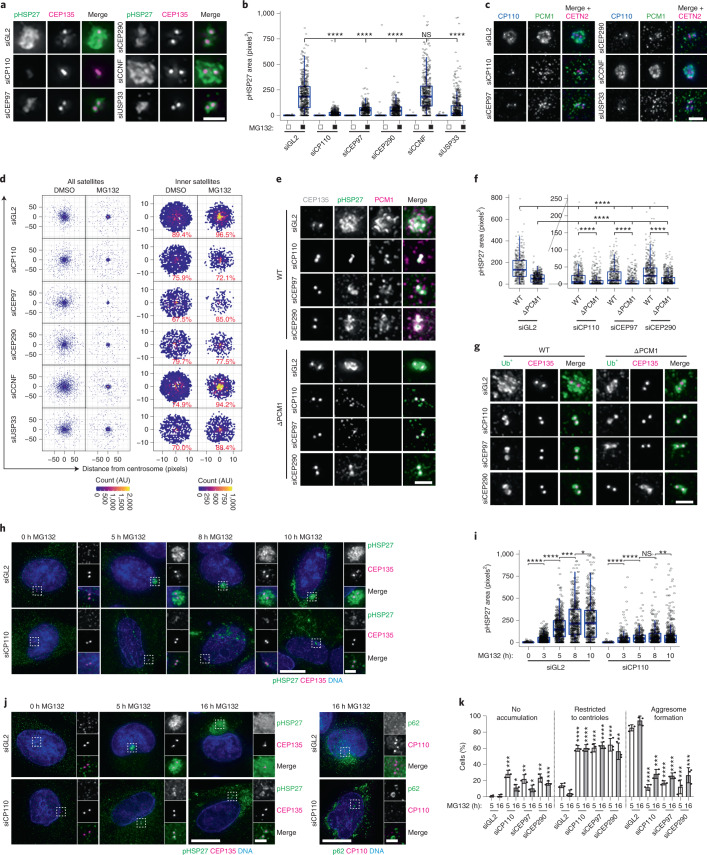
Fig. 5. A CP110–CEP97–CEP290 module is required for aggresome formation.
a, siRNA-transfected cells were treated and stained as indicated. b, Quantitation of pHSP27 area in cells treated as in a. n = DMSO: 705 (siGL2), 376 (siCP110), 372 (siCEP97), 691 (siCEP290), 579 (siCCNF), 472 (siUSP33); MG132: 517 (siGL2), 455 (siCP110), 396 (siCEP97), 449 (siCEP290), 475 (siCCNF) and 555 (siUSP33) aggresomes examined over 2 independent experiments. ****P < 0.0001. c, Cells treated as in a were stained as indicated. d, PCM1 distribution relative to the centrosome in cells treated as in a. The percentage of PCM1 in the inner region is indicated. e, siRNA-transfected WT and ΔPCM1 cells were treated and stained as indicated. f, pHSP27 area in cells treated as in e, with data from the same experiment displayed with different y axis ranges to ease comparison between knockdowns. Number of aggresomes examined over 2 independent experiments: WT: n = 408 (siGL2), 491 (siCP110), 518 (siCEP97) and 578 (siCEP290); ΔPCM1: n = 518 (siGL2), 510 (siCP110), 494 (siCEP97) and 699 (siCEP290). ****P < 0.0001. g, Cells treated as in e were stained as indicated. h, siRNA-transfected cells were treated and stained as indicated. i, pHSP27 area in siRNA-transfected WT cells treated with MG132. Number of aggresomes examined over 2 independent experiments: siGL2: n = 524 (0 h), 664 (3 h), 533 (5 h), 510 (8 h) and 519 (10 h); siCP110: n = 413 (0 h), 229 (3 h), 312 (5 h), 430 (8 h) and 550 (10 h). ****P < 0.0001, **P < 0.01, *P < 0.05. j, A-375 cells transfected with siGL2 or siCP110 were treated and stained as indicated. k, Aggresome formation in A-375 cells transfected and treated as indicated. Data displayed as the mean ± s.d., n = 3 independent experiments. ****P < 0.0001, **P < 0.01, *P < 0.05 by two-tailed unpaired Student’s t-test. For b, f and i, boxes represent the median, upper and lower quartiles, whiskers represent 1.5× the interquartile range, with individual values superimposed. Data were compared using Kruskal–Wallis ANOVA test and post-hoc Dunn multiple comparison test. Scale bars, 2 μm (a,c,e,g; insets of h,j) or 10 μm (h,j). Numerical data and P values are provided as source data. AU, arbitrary units.

