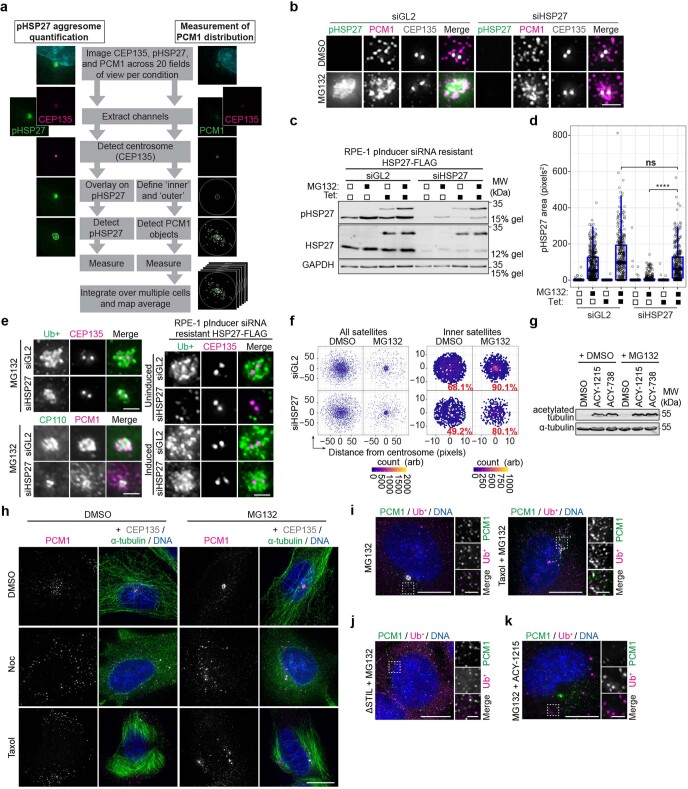
Extended Data Fig. 2. High-resolution quantitative analysis confirms a requirement for protein translation, HDAC6 and microtubules in aggresome formation.
(a) Schematic representation of the automated aggresome quantification and satellite mapping pipeline utilized in this study (see Methods). (b) RPE-1 cells were transfected with iRNAs and treated and stained as indicated. Scale bar 2 μm. (c) Immunoblots of extracts from MG132 treated RPE-1 cells expressing an inducible siRNA resistant HSP27-FLAG construct following treatment with control (GL2) or HSP27 siRNAs. Blots were probed as indicated. (d) Box-and-whisker plot showing the area occupied by pHSP27 in RPE-1 pInducer siRNA resistant HSP27-FLAG cells treated as indicated. Boxes represent the median, upper and lower quartiles, whiskers represent 1.5x the interquartile range, with individual values superimposed. n = siGL2: 482 (un-induced DMSO), 449 (un-induced MG132), 358 (induced DMSO), 386 (induced MG132); siHSP27 437 (un-induced DMSO), 360 (un-induced MG132), 399 (induced DMSO) and 333 (induced MG132) aggresomes examined over 2 independent experiments. Data were compared using a Kruskal-Wallis ANOVA test and a post-hoc Dunn multiple comparison test performed to calculate p-values. ****p < 0.0001. (e) Cells transfected with siRNAs were treated and stained as indicated. Scale bar 2 μm. (f) Intensity maps of PCM1 distribution relative to the centrosome in cells treated as indicated. The percentage PCM1 signal residing in the ‘inner’ region is indicated. Arb, arbitrary units. (g) Immunoblot of extracts from cells treated and probed as indicated. (h) RPE-1 cells were treated and stained as indicated. Scale bar 10 μm, inset 2 μm. (i) RPE-1 cells treated with MG132 and taxol were stained as indicated. Scale bar 10 μm, inset 2 μm. (j) STIL KO cells were treated with MG132 then stained for PCM1 and Ub+. Scale bar 10 μm, inset 2 μm. (k) RPE-1 cells treated with MG132 and the HDAC6 inhibitor ACY-1215 were stained as indicated. Scale bar 10 μm, inset 2 μm. Unprocessed immunoblots, numerical data and p values are provided as source data.

