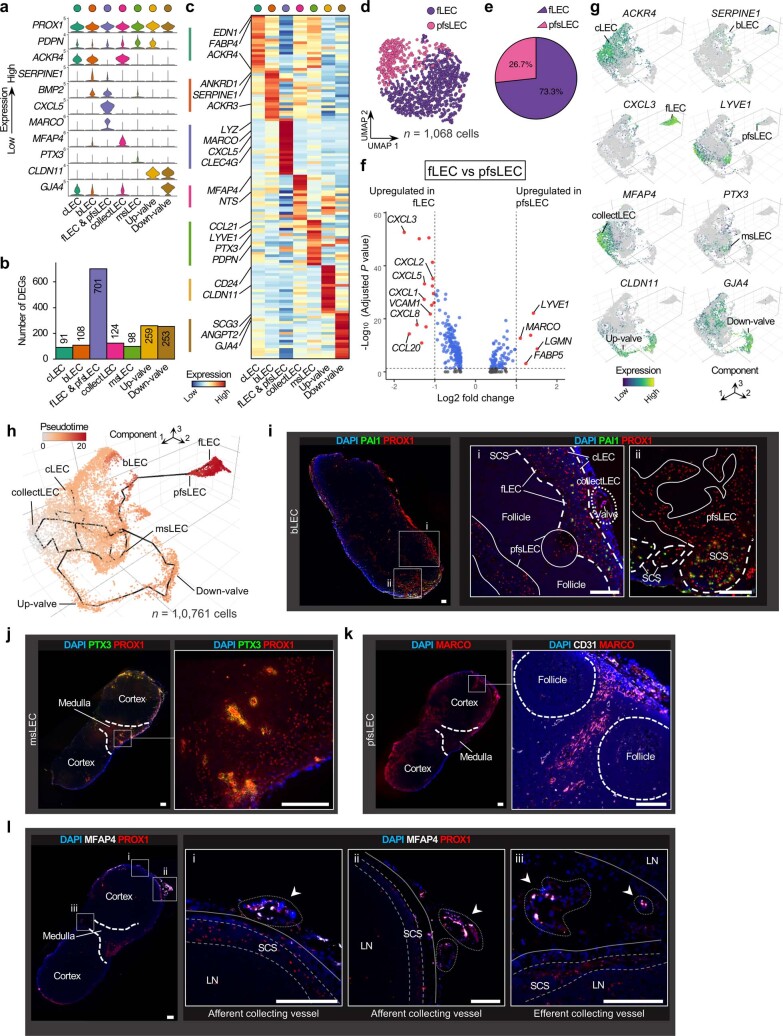
Extended Data Fig. 3. Dissection of human LN LECs at single-cell resolution.
a, Violin plots showing expression of top marker genes for each LEC subcluster. b, Number of DEGs per LEC subcluster. c, Heatmap showing expression of top-ranking marker genes for each LEC subcluster. Key genes are indicated on the left. d, UMAP plot of fLECs and pfsLECs discriminated by unsupervised sub-clustering of a single ‘fLEC and pfsLEC’ subcluster. e, Composition of fLECs and pfsLECs in the ‘fLEC and pfsLEC’ subcluster. f, Volcano plot of up- or down-regulated genes in fLECs and pfsLECs. Significance was determined as an adjusted P value of <0.05 (two-sided Wilcoxon Rank-Sum test with Bonferroni correction) (blue-coloured dots) and log2 fold-change of ≥1 (red-coloured dots). Key genes are labelled. g, Expression of marker genes for each LEC subcluster in a single-cell LEC object, generated by Monocle 3. h, Single-cell LECs, ordered according to pseudo-time developmental stages. Dark winding lines indicate putative developmental trajectories. Cell regions are assigned to LEC subclusters based on marker gene expression. i–l, IF staining of PAI1 (green) and PROX1 (red) to identify bridge LECs (bLECs). Bold dashed lines in magnified images (i and ii) indicate subcapsular sinuses (SCSs). Solid lines indicate perifollicular sinuses. Scale bars, 500 μm (left panel), 200 μm (magnification panels) (i); PTX3 (green) and PROX1 (red) to identify medullary sinus LECs (msLECs). Dashed lines indicate boundaries between the LN cortex and medullary regions. High magnification image at right corresponds to boxed area at left. Scale bars, 200 μm (j); MARCO (red) for identification of perifollicular sinus LECs (pfsLECs). High magnification image at right shows staining of CD31 (white) and MARCO (red). Dashed lines indicate boundaries between the LN cortex and medullary regions (left) or follicles (right). Scale bars, 200 μm (k); MFAP4 (white) and PROX1 (red) to identify collecting vessel LECs (arrowheads). High magnification images show afferent (i and ii) or efferent (iii) collecting vessels. Bold dashed lines in left panel indicate boundaries between the LN cortex and medullary regions. Scale bars, 200 μm (l). Representative images from one of three independent experiments are shown.

