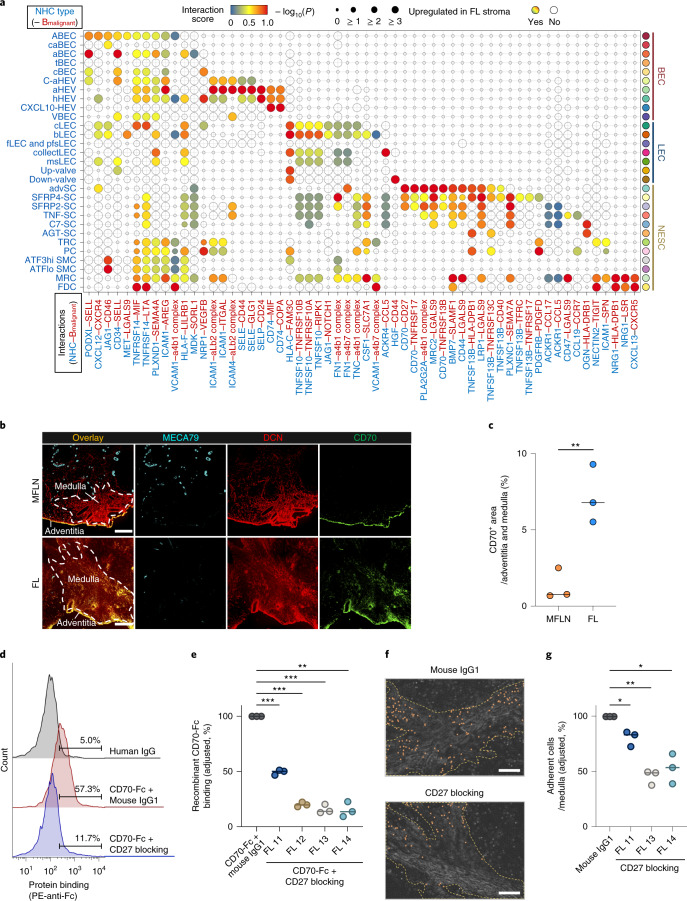
Fig. 6. Dissection of stroma–malignant B-cell interactions in FL.
a, Enhanced interactions across FL NHC subclusters and malignant B cells (Bmalignant). Circle size indicates the negative log10 of adjusted P values (Methods). Circles are coloured when a stroma-derived factor is upregulated in relevant FL subclusters. b, IF staining for MECA-79 (cyan), DCN (red) and CD70 (green) in MFLN and FL samples. Scale bars, 200 μm. Representative images from one of three independent experiments are shown. c, Proportions of CD70+ area in medullary and adventitia regions of MFLN (n = 3) and FL (n = 3) samples. Circles represent biologically independent samples. Bars indicate the median. **P = 0.0095 (two-sided unpaired t-test). d, Binding of FL CD19+CD10+ cells to CD70-Fc protein with an anti-CD27 blocking antibody or isotype human IgG. The histograms represent three independent experiments (FL 13) with the count in arbitrary units. e, Blocking of FL CD19+CD10+ cell binding to CD70-Fc protein after treating cells with an anti-CD27 blocking antibody (n = 3) or isotype mouse IgG1 (n = 3) in CD27+ FL samples (FL 11–FL 14). Proportions of cells bound to CD70-Fc protein were adjusted by subtracting nonspecific binding observed with human IgG. CD70-Fc protein binding to cells treated with isotype mouse IgG1 was set to 100% in each experiment. Circles represent independent experiments. Bars indicate the median. **P = 0.0022, ***P = 7.3 × 10⁻⁴ (FL 11), ***P = 2.2 × 10⁻⁴ (FL 12), ***P = 7.6 × 10⁻⁴ (FL 13) (two-sided paired t-test). f, Representative malignant B-enriched cell (FL 14) adhesion to medullary regions of FL in the presence of an isotype mouse IgG1 or anti-CD27 antibody. Orange dots indicate adherent cells. Yellow dashed lines indicate medullary regions. Scale bars, 200 μm. g, Blocking of malignant B-enriched cell (FL 11, FL 13 and FL 14) adhesion to FL medullary regions (per mm2) after treating cells with an anti-CD27 blocking antibody (n = 3) or isotype mouse IgG1 (n = 3). Adhesion of cells treated with isotype mouse IgG1 was set to 100% in each experiment. Circles represent independent experiments. Bars indicate the median. *P = 0.041 (FL 11), *P = 0.027 (FL 14), **P = 0.0050 (two-sided paired t-test). Statistical source data are provided.

