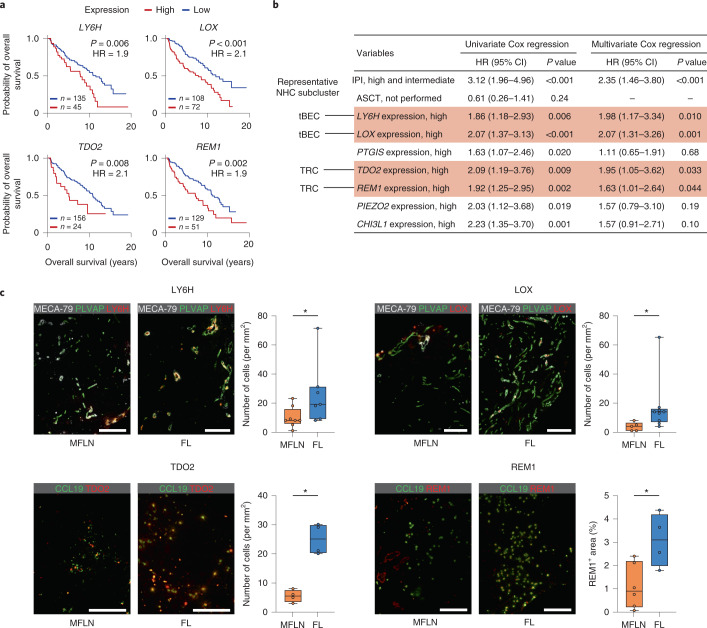
Fig. 7. Identification of stroma-derived prognostic markers in FL.
a, Kaplan–Meier curves showing the overall survival of patients newly diagnosed with FL (n = 180) based on the expression level of LY6H, LOX, TDO2 and REM1. Statistical analysis was performed using the two-sided log-rank test. HR, hazard ratio. b, Univariate and multivariate Cox regression analyses predicting overall survival (n = 180). Statistical analysis was performed using two-sided Cox proportional-hazards analysis. Significant gene expression in multivariate analysis is indicated by text shaded in red. Representative NHC subcluster denotes subclusters in which indicated gene expression is most greatly upregulated in FL. CI, confidence interval. c, Left: images of IF staining for LY6H, LOX, TDO2 and REM1 in representative MFLN and FL samples. Scale bars, 200 μm. Right: the box plots show the interquartile range (box limits), median (centre line), minimum to maximum values (whiskers), and biologically independent samples (circles) for quantification of cell number (for LY6H, LOX and TDO2) or area (for REM1) positive for each protein in MFLN and FL samples (MFLN, n = 8, 5, 4 and 6; FL, n = 7, 9, 4 and 4 for LY6H, LOX, TDO2 and REM1, respectively). *P = 0.029 (LY6H), *P = 0.010 (LOX), *P = 0.029 (TDO2), *P = 0.038 (REM1) (two-sided Mann–Whitney U-test). Statistical source data are provided.

