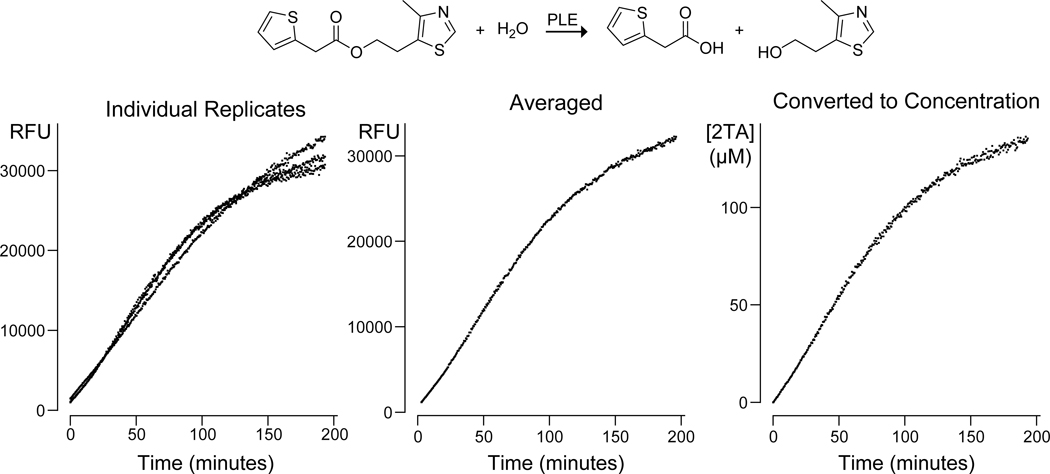
Figure 4.
Graphs shows raw individual replicates, averaged replicate, and concentration results for the hydrolysis of the 2TA–sulfurylester by pig liver esterase (PLE). The raw data as well as the R code for creating the graphs is available at https://github.com/hetrickk/Plots_for_MIE.

