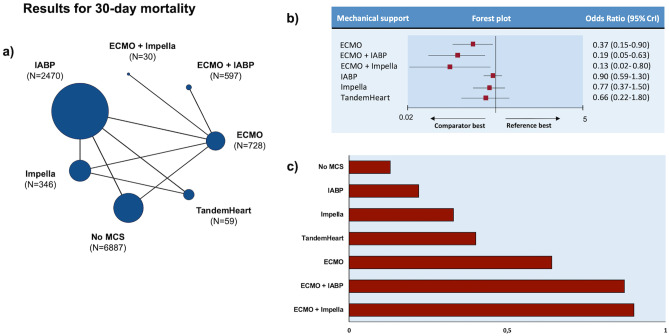
Fig. 1.
Analysis of 30-day mortality. a Treatments network. Each treatment is represented by a colored circle (node) of size proportional to the number of studies in which it was evaluated. The number of patients receiving each treatment is reported in parentheses. b Forest plot. Reference is “no MCS”, whereas comparators are shown on the left part of the panel. c Treatment ranking according to SUCRA values. Red bars indicate SUCRA values on a scale from 0 to 1. Longer bars (i.e., higher SUCRA values) indicate better-performing treatment. Abbreviations: CrI credible interval, ECMO extra-corporeal membrane oxygenation, IABP intra-aortic balloon pump, MCS mechanical circulatory support

