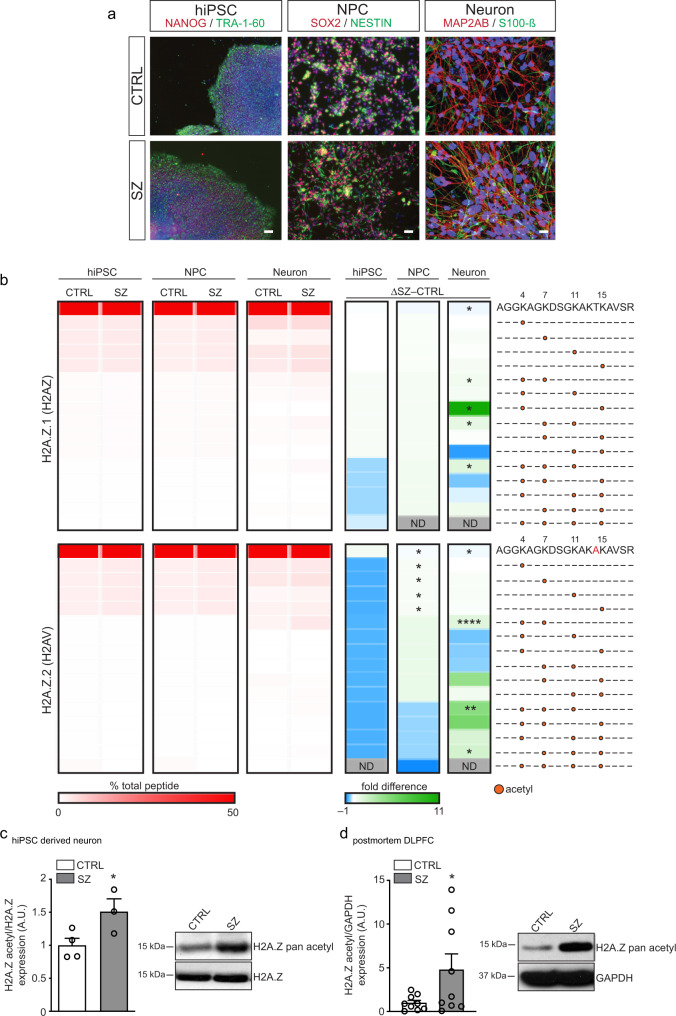
Fig. 1. Combinatorial histone hyperacetylation in SZ neurons.
a Representative (repeated >3X/group) patient-specific hiPSCs, NPCs, and neurons. Left-hiPSCs express NANOG (green) and TRA-1-60 (red). DAPI (blue). Center-hiPSC neural progenitor cells (NPCs) express NESTIN (green) and SOX2 (red). DAPI (blue). Right-hiPSC neurons express S100 calcium-binding protein B (green) and the dendritic marker MAP2AB (red). DAPI (blue). Scale bar 100 μm. b Heatmap depicting LC-MS/MS data for relative enrichment values of (un)modified and acetylated histones H2AZ.1 and H2AZ.2 in hiPSCs (n = 3/group), NPC (n = 3/group), and 4-week-old neurons from SZ vs. matched controls (n = 4/group). Absolute values (% total peptide) for each peptide are provided. Fold differences between SZ vs. controls are represented (biologically independent replicates/cell-type/condition). Heatmap data represented as means, *p ≤ 0.05, **p ≤ 0.01, ****p ≤ 0.0001 (two-tail Student’s t-tests performed within cell-type, SZ vs. CTRL; adjustments were not made for multiple comparisons). Please see Supplementary Data 1 for LC-MS/MS source data. Increased patterns of H2A.Z acetylation were confirmed via western blotting in c 4-week-old hiPSC neurons [n = 3 (SZ) vs. 4 (CTRL) biologically independent replicates], *p = 0.0538 (two-tail Student’s t-tests), and in d DLPFC from biologically independent postmortem SZ subjects vs. matched controls (n = 9 per group; two-tail Student’s t-tests), *p = 0.0510. Total H2A.Z and GAPDH were used as normalization controls, respectively. A.U. = arbitrary units (normalized to CTRL samples). Data are presented as averages ± SEM. Source data are provided in Source Data files.

