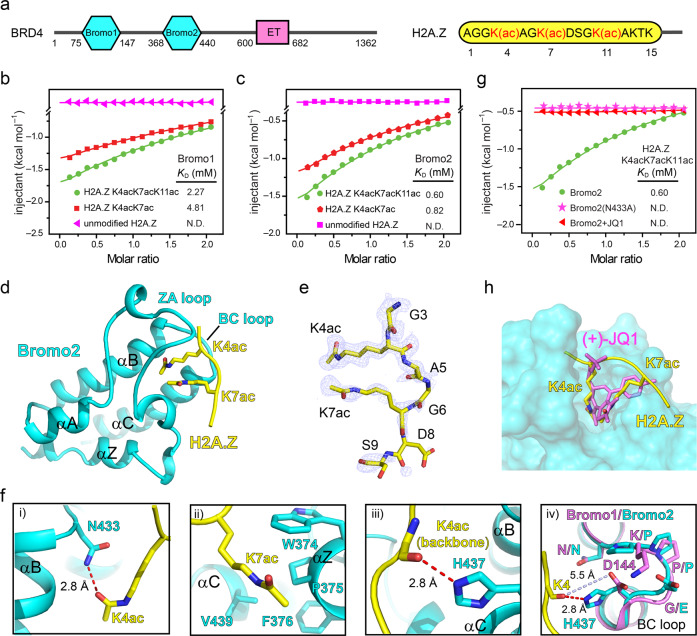
Fig. 2. Molecular basis underlying BRD4 and H2A.Zac interactions.
a Domain architecture of BRD4 and H2A.Z peptide sequence. ITC fitting curves for b BRD4Bromo1 and c BRD4Bromo2 titrated with unmodified, di- and tri-acetylated H2A.Z (1–15) peptides. d The overall structure of BRD4Bromo2 in complex with the H2A.Z (1–12) K4acK7acK11ac peptide. Bromo2 (cyans) and the histone H2A.Z peptide (yellow) are shown as ribbons; K4ac and K7ac of H2A.Z (yellow) are depicted as sticks. e Fo-Fc map of H2A.Z peptide in H2A.ZBromo2 complex counters at 2.0 σ and is shown as light-blue meshes. f Interaction details of H2A.Z (1–12) K4acK7acK11ac peptide recognized by BRD4Bromo2, and structural alignment of Bromo1 and 2. K4ac (i), K7ac (ii), K4 (iii), and K4 (iv) of H2A.Z are shown as yellow sticks. Hydrogen bonds and distance are shown as red and light-blue dashes, respectively. Key residues of Bromo1 and Bromo2 are depicted as cyans and violet sticks, respectively. g ITC fitting curves of H2A.Z (1–15) K4acK7acK11ac peptide titrated into wild type, mutant and (+)-JQ-1 saturated Bromo2 of BRD4. N.D. = not detected. h Structural alignment of (+)-JQ-1 (violet) and H2A.Z peptide (yellow) in complex with BRD4Bromo2 (cyans surface).

