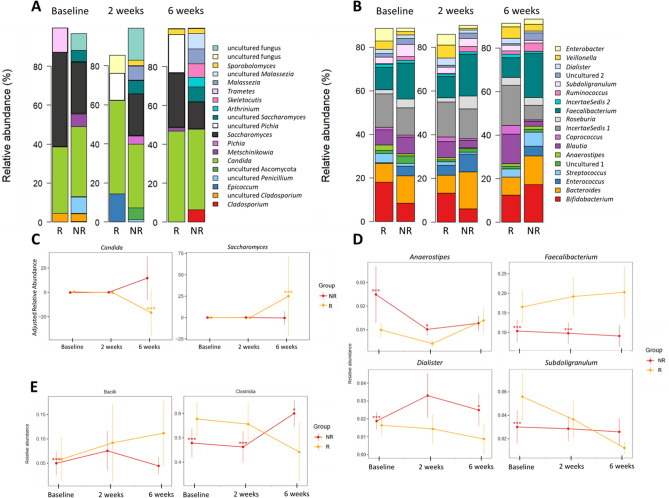
Figure 2.
Overview of the fecal (A) fungal mycobiota and (B) bacterial microbiota composition before start of infliximab (IFX) therapy (baseline), two weeks and six weeks after treatment stratified by response to induction therapy to IFX. The plots present the most abundant genera, which are color-coded and shown on the right-side panel. (C) The standardized confounder-adjusted relative abundance of the fungal genera that significantly differed between response groups presented throughout the study and (D) the relative abundance of the bacterial genera and (E) classes that differed significantly at baseline between response groups presented throughout the study. R presents responders and NR presents non-responders. (*p FDR).

