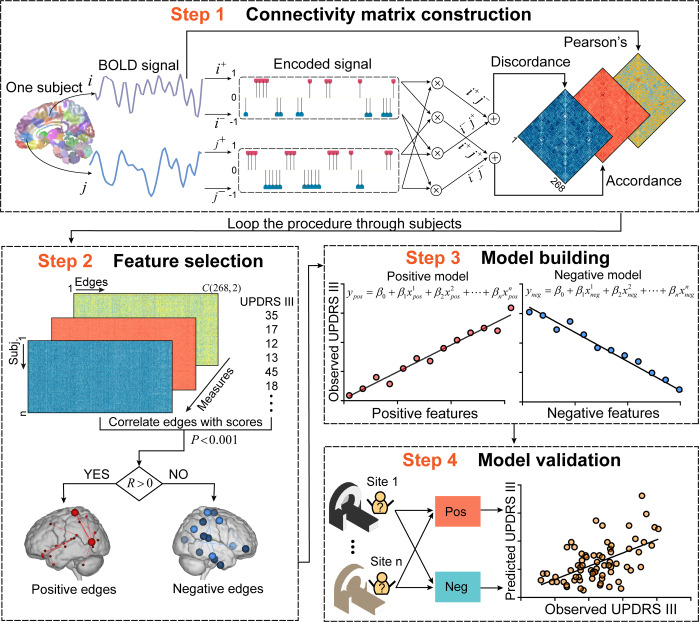
Fig. 1. Schematic representation of connectome-based predictive modeling for motor dysfunction in PD.
Step 1: We extracted the mean signal from regions of interest (ROIs), then positive extreme values of the z-transformed time series were encoded as 1, whereas negative extreme values were encoded as -1. The encoded series was subsequently sent into two layers. The first layer (dot product layer) produced sub-states of connectivity for each pair of ROIs, and the last layer (accumulation layer) quantified the synchronized interactions (accordance) and antagonistic interactions (discordance). Connectivity matrices based on three FC measures were constructed for each subject. Step 2: We looped step 1 through subjects and created a group-level matrix (m×n, where m represents subjects, and n represents FC). The significantly motor-correlated edges (P < 0.001) were selected and divided into positive features (R > 0) and negative features (R < 0). Step 3: We trained a multivariate linear regression model using partial least squares based on selected features. Step 4: Apply models to novel subjects in independent samples to assess the generalizability. Brain images in this figure were obtained from the Bioimage Suite (https://bioimagesuiteweb.github.io/webapp/), which is an open source software package. UPDRS III Unified Parkinson’s Disease Rating Scale motor examination; FC functional connectivity.

