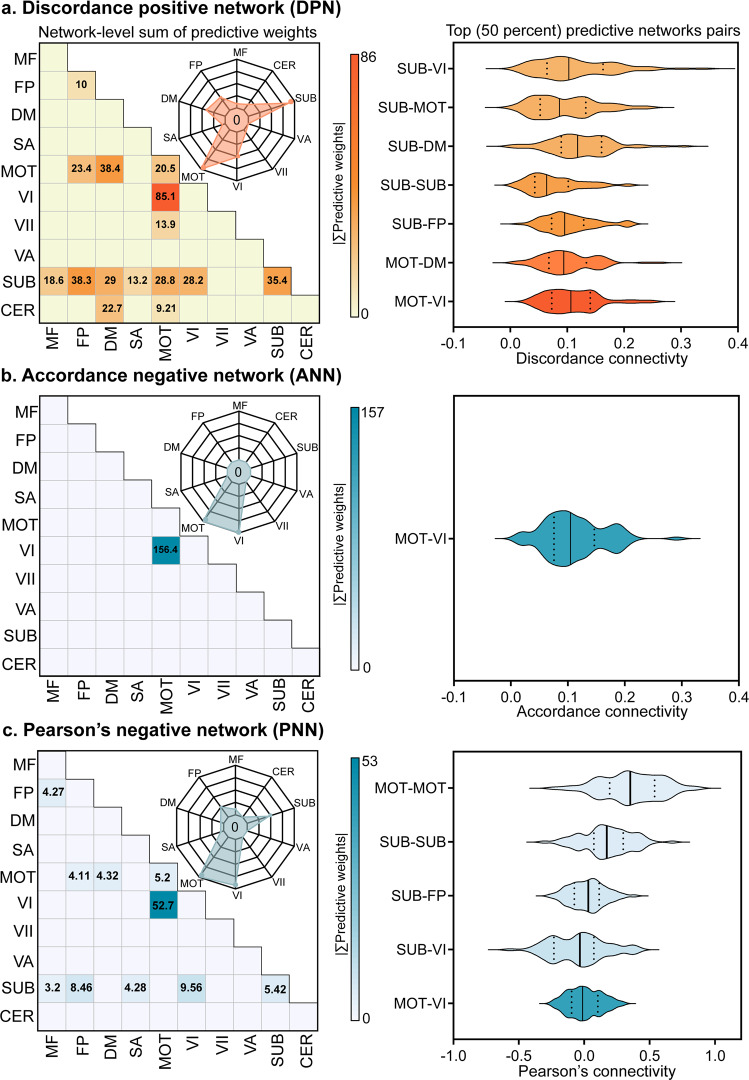
Fig. 3. Network level representation of predictive weights and the distribution of top 50% network pairs on the discovery cohort (n = 71).
268 ROIs were divided into 10 canonical functional networks, and we characterized the whole predictive networks (a–c) from the edge-level (within- and between- networks, shown as heatmaps) and node-level (shown as radar charts) by aggregating all related weights. The first half of the predictive network pairs were selected according to the sorted weights, and the mean strength of network interactions were shown in the second column. The black solid lines in the violin plots represents for the median value, and the dash lines represents for the upper and lower quartiles in each network pair. Networks acronyms: MF Medial Frontal, FP Frontal Parietal, DM Default Mode, MOT Motor, VI Visual I, VII Visual II, VA Visual Association, SUB Subcortical, CER Cerebellum.

