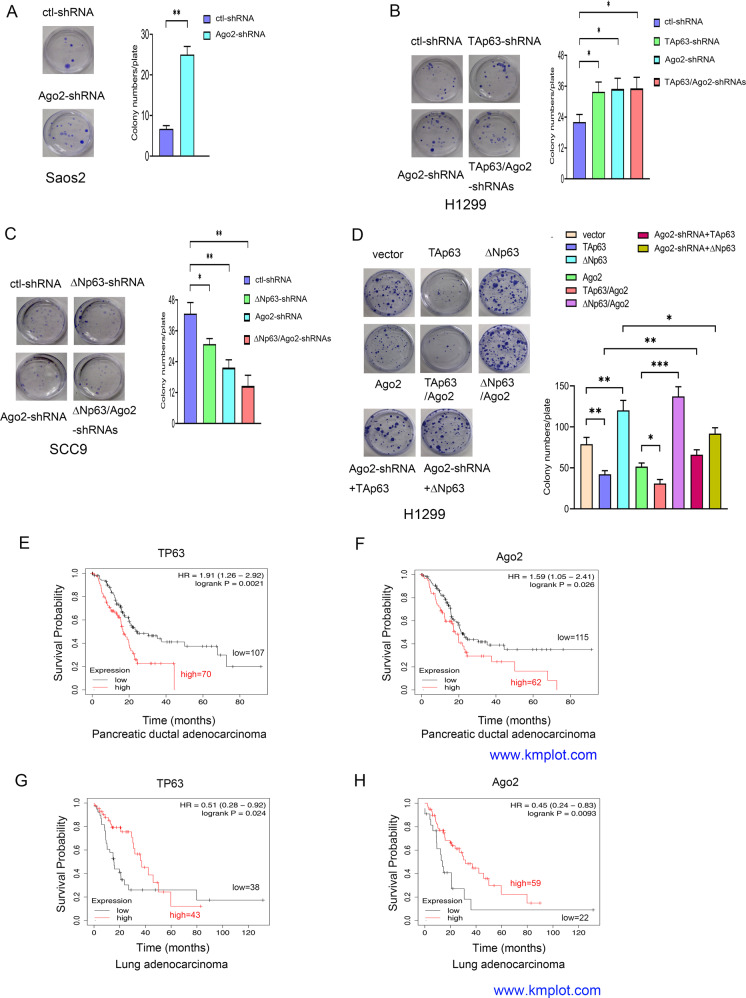
Fig. 3. The effects of Ago2 on p63-mediated cell growth.
The expression levels and prognosis of Ago2 and TP63 in human cancers. A The proliferative capability of Ago2- knockdown was tested through colony assays in Saos2 cells. Colony numbers were counted. B, C The proliferative capabilities of H1299 (B) and SCC9 cells (C) transfected with p63 shRNA or Ago2 shRNA alone or together were tested through colony assays as indicated. D The proliferative capability of H1299 cells transfected with TAp63, ΔNp63, or Ago2 alone or together with Ago2 was examined by colony assays. In addition, H1299 clones stably expressing Ago2-shRNA were transfected with plasmids expressing TAp63 or ΔNp63 as indicated. Colony numbers were countered and plotted. All experiments were performed in triplicate. *P < 0.05, **P < 0.01, ***P < 0.001. E, F. Kaplan–Meier survival curves revealed that patients with high levels of TP63 and Ago2 had a significantly lower overall survival in human pancreatic ductal adenocarcinoma (www.kmplot.com). G, H Kaplan–Meier survival curves generated from www.kmplot.com revealed that patients with high levels of TP63 and Ago2 had significantly better overall survival in human lung adenocarcinoma.

