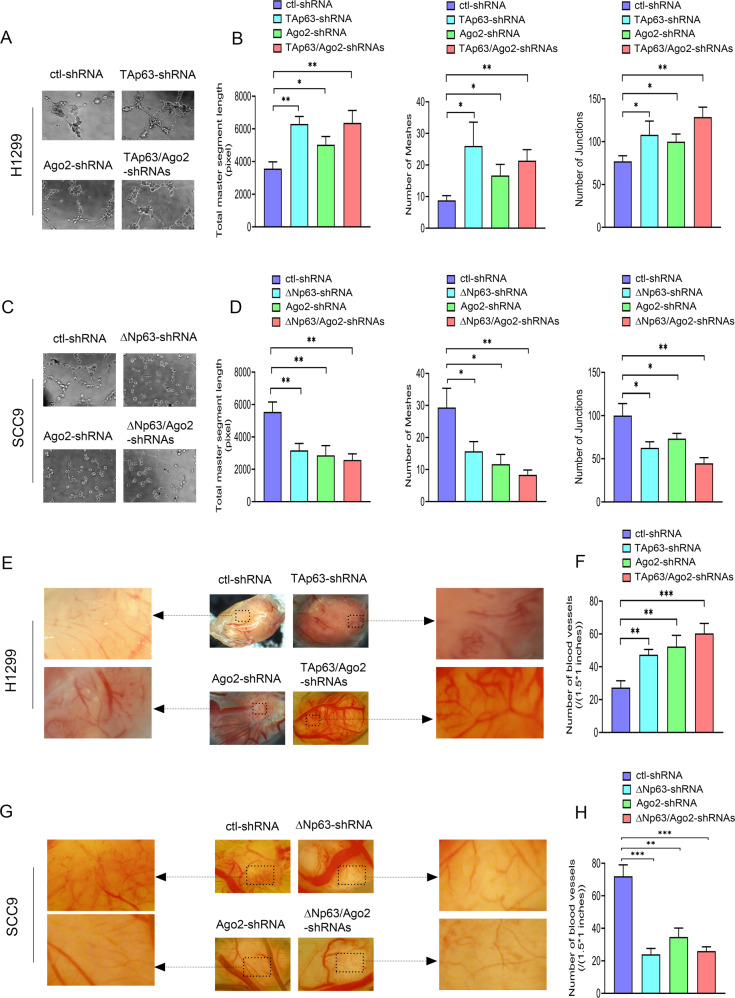
Fig. 4. The regulatory effects of Ago2 on tumor angiogenesis are related to p63 isoforms in cells.
A–D tube formation assay. A, C Representative images and (B, D) quantitative analysis of tube formation assay characterizing total master segment length, junction numbers, and mesh numbers in H1299 cells (A, B) or SCC9 cells (C, D) transfected with shRNAs for p63 or/and Ago2 as indicated. n = 3 per group. E–H CAM assays. E, G Representative images and (F, H) quantitative analysis of the CAM assay characterizing neovascularization in the chick CAM of H1299 clones (E, F) or SCC9 clones (G, H) expressing shRNAs for p63 or/and Ago2 as indicated. H1299 clones (5 × 10⁶ cells) or SCC9 clones (2 × 10⁷ cells) stably expressing shRNAs for p63 and/or Ago-2 were suspended in Matrigel and then inoculated onto the chick CAM. After 11 days, the primary tumors were imaged at 2X by a dissecting microscope. Images are representative of tumors from three separate experiments. Magnified images indicated by the arrow represent the typical vascular area (size: 1.5 × 1 inches in the original image (7.2 × 5.6 inches)) on tumors. Neovascularization was quantified by counting the number of capillaries of the typical vascular area (1.5 × 1 inches) on the tumor. All experiments were performed in triplicate. *p < 0.05; **p < 0.01; ***p < 0.001.

