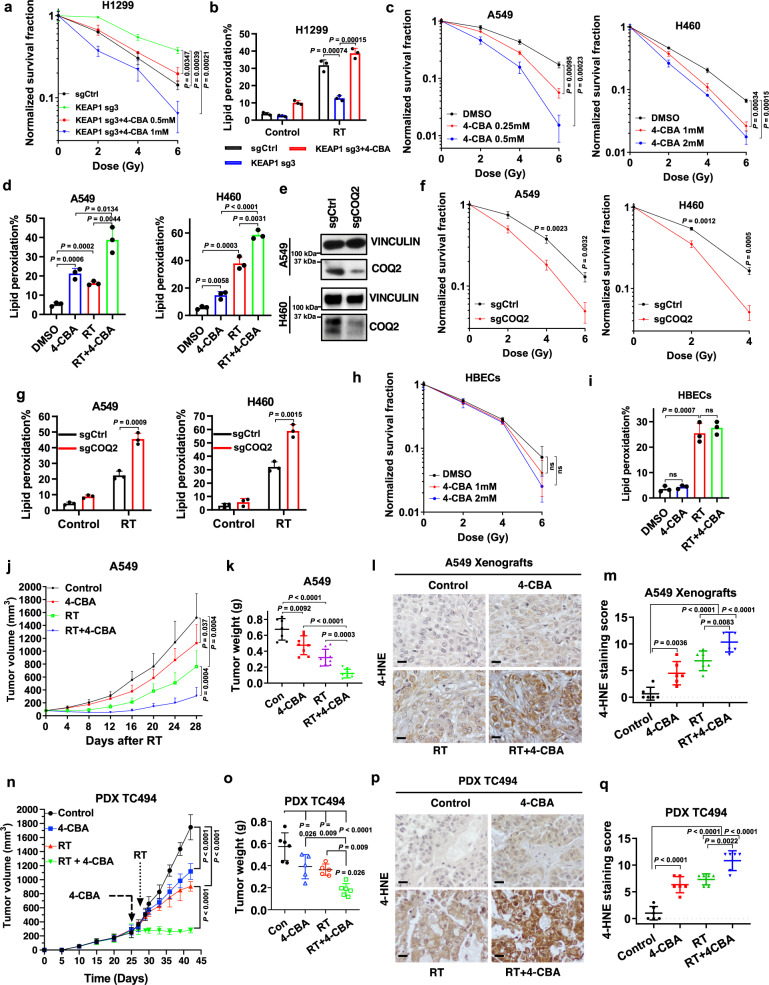
Fig. 6. Inhibiting CoQ synthesis reverses radioresistance in KEAP1 deficient or mutant lung cancer cells or tumors.
a Clonogenic survival curves of the indicated H1299 cells exposed to X-ray irradiation at indicated doses following pretreatment with the indicated doses of 4-CBA or DMSO for 24 h. b Lipid peroxidation levels in the indicated H1299 cells at 24 h after exposure to 6 Gy X-ray irradiation following pretreatment with 4-CBA or DMSO for 24 h. c Clonogenic survival curves of A549 and H460 cells exposed to X-ray irradiation at indicated doses following pretreatment with the indicated doses of 4-CBA or DMSO for 24 h. d Lipid peroxidation levels in A549 and H460 cells at 24 h after exposure to 6 Gy X-ray irradiation following pretreatment with 4-CBA or DMSO for 24 h. e Protein levels of COQ2 in A549 and H460 COQ2 KO cells. f Clonogenic survival curve of the indicated A549 and H460 cells exposed to X-ray irradiation at indicated doses. g Lipid peroxidation levels in the indicated A549 or H460 cells at 24 h after exposure to 6 Gy X-ray irradiation. h Clonogenic survival curves of HBECs cells exposed to X-ray irradiation at indicated doses following pretreatment with the indicated doses of 4-CBA or DMSO for 24 h. i Lipid peroxidation levels in HBECs cells at 24 h after exposure to 6 Gy X-ray irradiation following pretreatment with 4-CBA or DMSO for 24 h. j Tumor volumes of A549 xenografts with indicated treatments at different time points (days) following exposure to 10 Gy of X-ray irradiation. Error bars are means ± SD, n = 7 or 8 tumors. k Tumor weights of A549 xenografts in the indicated treatment groups. Error bars are means ± SD, n = 7 or 8 tumors. l, m Representative images (l; scale bars, 20 μm) and scores (m) of IHC staining for 4-HNE in A549 xenograft tumors with indicated treatments. Error bars are means ± SD, n = 6 randomly selected magnification fields. n Tumor volumes of PDX TC494 in the indicated treatment groups at different time points (days) following exposure to 10 Gy of X-ray irradiation. Error bars are means ± SD, n = 5 or 6 tumors. o Tumor weights of PDX TC494 in the indicated treatment groups. Error bars are means ± SD, n = 5 or 6 tumors. p, q Representative images (p; scale bars, 20 μm) and scores (q) of IHC staining for 4-HNE in PDX TC494 tumors with indicated treatments. Error bars are means ± SD, n = 6 randomly selected magnification fields. Data were presented as (if mentioned otherwise) mean ± SD; n = 3. P value was determined by a two-tailed unpaired Student’s t-test; ns not significant. Source data are provided as a Source Data file.

