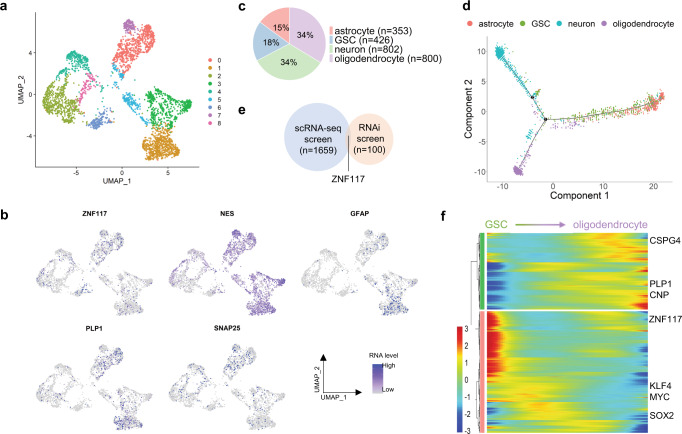
Fig. 2. Single-cell trajectory analysis suggests that ZNF117 regulates GSC differentiation towards an oligodendroglial lineage.
a UMAP of scRNA-seq data from GS5 cells. Unsupervised clustering based on top 1000 variable genes reveals cell–cell heterogeneity within the GS5 tumor population. b Expression of cell type-specific markers and ZNF117 in UMAP. Expression of NES (GSC), GFAP (astrocytes), PLP1 (oligodendrocytes), and SNAP25 (neurons) is shown. c Distribution of cell types identified from GS5 scRNA-seq data. Neurons and oligodendrocyte each compose of around 33% of the tumor, while GSCs and astrocytes each compose of 18% and 15% of the tumor, respectively. d Single-cell trajectories of cell types identified in c. GSCs are in the center of the graph, while each of the differentiated cell types form their own distinct branch. e Venn diagram of significant genes that regulate oligodendrocyte differentiation from single-cell trajectory analysis and Nestin expression from the RNAi screen. ZNF117 appears in both screens. f Heatmap of significant genes that regulate GSC to oligodendrocyte differentiation. ZNF117 decreases in expression as GSCs differentiate into oligodendrocytes. Color bar represents normalized expression. Genes are hierarchically clustered according to their expression pattern. q-value < 5e-02.

