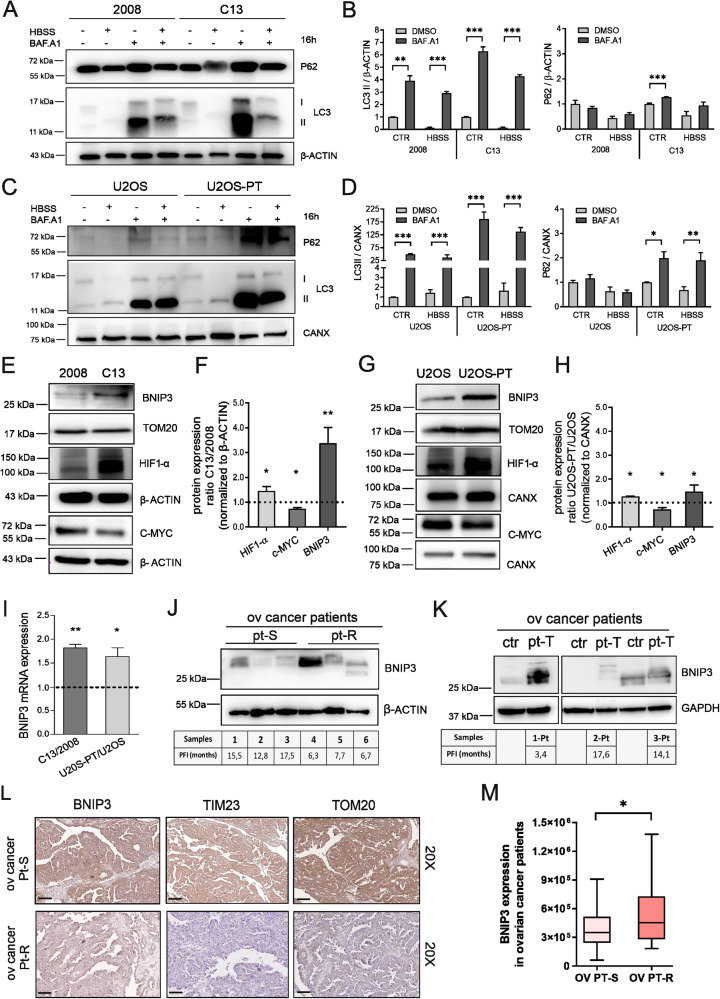
Fig. 3. Resistant clones boost the autophagic flux in association with higher expression of hypoxia-induced BNIP3.
A and C Autophagic flux was measured by assessing levels of p62, LC3 BI, LC3 BII after 16 h starvation in HBSS, upon 200 nM Bafilomycin A1 treatment or HBSS in combination with Bafilomycin A1. The optical density was normalized on β-ACTIN (2008-C13) (B) and (D) on calnexin (U2OS-U2OS-PT). The data are expressed in the percentage of treated cells with respect to untreated cells. Data are the mean ± SEM of 4–5 different experiments. *p < 0.05; **p < 0.01; ***p < 0.001, calculated by a two-tailed unpaired t-test comparing Bafilomycin A1 treatment vs DMSO treated cells. E BNIP3, c-MYC, HIF-1α protein expression of 2008 and C13 normalized respectively to TOM20 and to β-ACTIN and respective quantification (F). BNIP3, c-MYC, HIF-1α proteins expression of U2OS-U2OS-PT normalized respectively to TOM20 and to calnexin (G) and respective quantification (H). Data are expressed as the ratio of resistant cells to sensitive. Data are the mean ± SEM of 4–5 different experiments; *p < 0.05, **p < 0.01; calculated by a two-tailed unpaired t-test comparing resistant vs sensitive cells. I mRNA expression of BNIP3 gene normalized on β-ACTIN (2008-C13) and calnexin (U2OS and U2OS-PT). The data are expressed as a ratio of resistant cells to sensitive set to 1. *p < 0.05, **p < 0.01, calculated by a two-tailed unpaired t-test comparing resistant vs sensitive cells. J BNIP3 expression in ovarian cancer patients sensitive (pt-S) and resistant (pt-R) to platinum-based chemotherapy (platinum free interval, PFI, if lower than 12months has been defined to classify resistant patients). K BNIP3 expression in another ovarian cancer patients’ group before and after platinum-based chemotherapy (ctr refers to non-treated patient and pt-T to treated patient). The first patient was treated with carboplatin in combination with doxorubicin and presented a higher BNIP3 expression and lower survival (PFI < 12months). The other two patients were treated with carboplatin in combination with taxol and presented lower BNIP3 expression and higher survival (PFI > 12months). L Representative images of ovarian cancer specimens (n = 2) showing low (0–20%) and high (55–100%) staining of TIM23, TOM20 and of BNIP3 in tumor tissue. Black scale bars = 100 μm. Between the two cancer patients treated with platinum-based chemotherapy after surgery, lower TIM23 and TOM20 protein expression was associated with platinum-resistant patient (pt-R), as compared to platinum-sensitive patient (pt-S). M Among the 295 ovarian cancer patients treated with platinum-based therapy (cisplatin, carboplatin, or oxaliplatin after surgery), high BNIP3 protein expression was associated with lower PFS (OV PT-R, ovarian cancer patient resistant to platinum-therapy) compared to patients with low BNIP3 expression (OV PT-S, ovarian cancer patient sensitive to platinum-therapy) (Wilcox-rank test, two-sided, p < 0.05).

