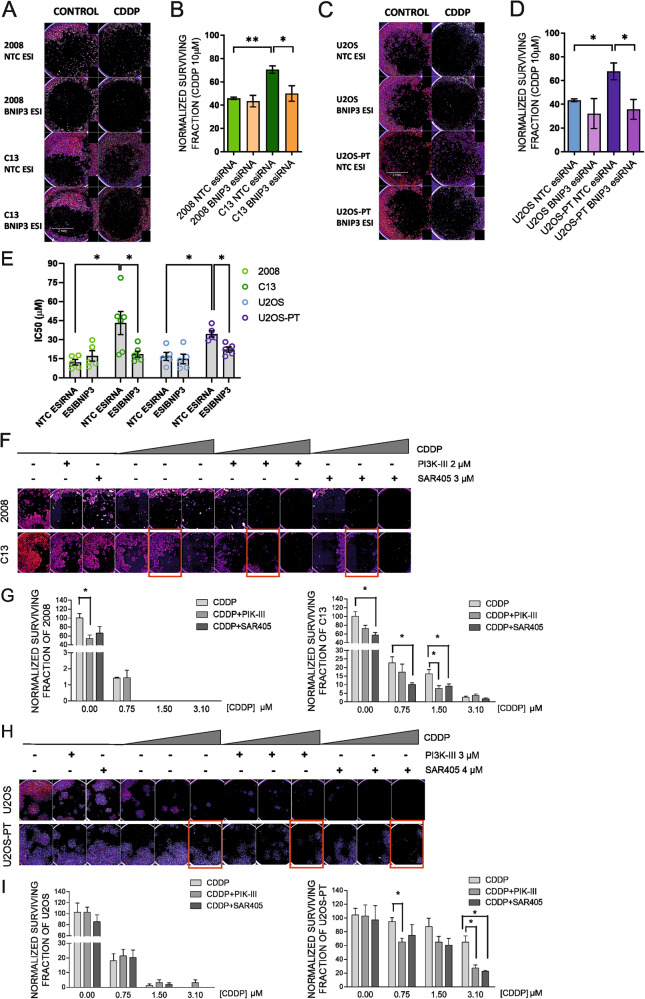
Fig. 6. BNIP3 silencing and pharmacological inhibition of autophagy promotes CDDP sensitivity.
Clonogenic assay of 2008-C13 (A) and U2OS-U2OS-PT (C) cells transfected with a control NTC esiRNA (scramble esiRNA) or esiRNA targeting BNIP3 (esiBNIP3) and treated for 24 h with CDDP (10–50 µM). The respective quantification of normalized surviving factor of the experiment in (A–C) is reported in (B) and (D). Data are the mean ± SEM of 4–5 different experiments. *p < 0.05; **p < 0.01; calculated by a two-tailed unpaired t-test comparing esiBNIP3 cells vs NTC esiRNA cells and comparing resistant vs sensitive counterparts. E IC50 of viability curves upon 24 h of CDDP (1–5–10–25–50 µM) of 2008-C13 and of U2OS-U2OS-PT transfected with non-targeting control (NTC, scramble) esiRNA or with an esiRNA targeting BNIP3 (esiBNIP3). Data are the mean ± SEM of 5–6 different experiments. *p < 0.05, calculated by a two-tailed unpaired t-test comparing esiRNA targeting BNIP3 (esiBNIP3) resistant vs sensitive cells and non-targeting control (NTC, scramble) esiRNA resistant vs sensitive cells; *p < 0.05, esiRNA targeting BNIP3 cells vs non-targeting control cells. Clonogenic assay of ovarian cancer cells treated for 72 h with CDDP (0.75–1.5–3.1 µM) in combination with either DMSO, 3 µM PIK-III or 2 µM SAR-405 (F). Quantification of the normalized surviving factor (G) of the experiment shown in (F). Clonogenic assay of osteosarcoma cells treated for 72 h with CDDP (0.75–1.5–3.1 µM) in combination with either DMSO, 3 µM PIK-III or 4 µM SAR-405 (H). Quantification of the normalized surviving factor (I) of the experiment shown in (H). Data are the mean ± SEM of 4–5 different experiments. *p < 0.05; calculated by a two-tailed unpaired t-test comparing combination treatment vs the CDDP treatment.

