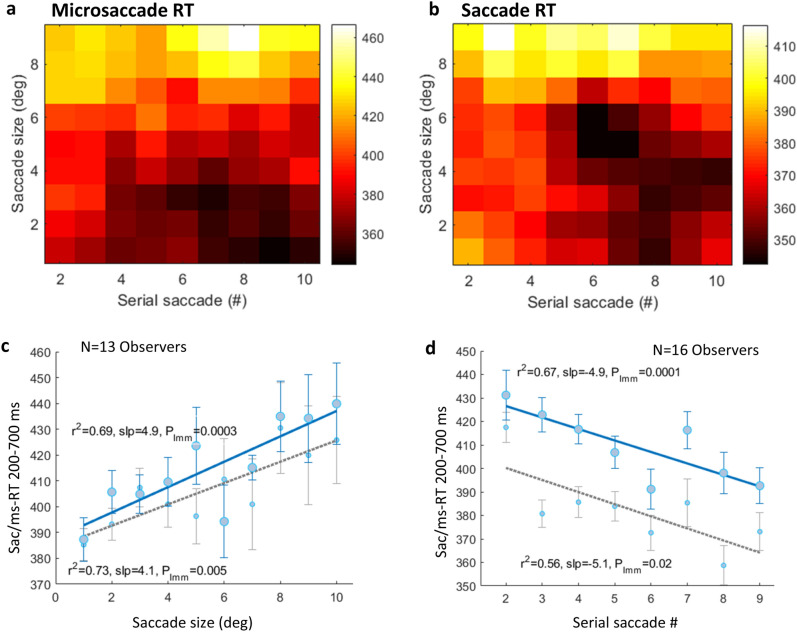
Figure 5.
The results for experiment 2: Facilitation over repeated saccades and the saccade size. A fixation-related microsaccade (a) and saccade (from MS-free fixations) and (b) RTs as a function of the serial saccade number over time (X-axes) and saccade size (Y-axes). Light and dark colors represent longer and shorter RTs, respectively. 2D smoothing was applied (see the “Methods” section) and all conditions were combined for a clearer demonstration of the similar trend for msRT and sacRT. (c) A fixation-related saccade (blue)/microsaccade (gray) latency (sac/ms RT) as a function of saccade distance (deg), averaged across observers (n = 13) with 1SE error bars computed on the demeaned data (see the “Methods” section). Significance was assessed using LMM (see the “Methods” section). b(slope) = 4.9, t(118) = 3.77, p ≤ 0.0003 with CI (2.3, 7.5); b(slope) = 4.1, t(118) = 2.8, p ≤ 0.005 with CI (1.2, 7), for sacRT and msRT, respectively. (d) A fixation-related saccade (blue)/microsaccade (gray) latency (sac/ms RT) as a function of the serial saccade number, averaged across observers (n = 16) with 1SE error bars computed on the demeaned data (see the “Methods” section). Significance was assessed using LMM (see the “Methods”); b(slope) = − 4.9, t(126) = − 3.9, p ≤ 0.0001 with CI (− 7.3, − 2.4); b(slope) = − 3, t(118) = − 2.2, p ≤ 0.02 with CI (− 5.7, − 0.3), for sacRT and msRT, respectively.

