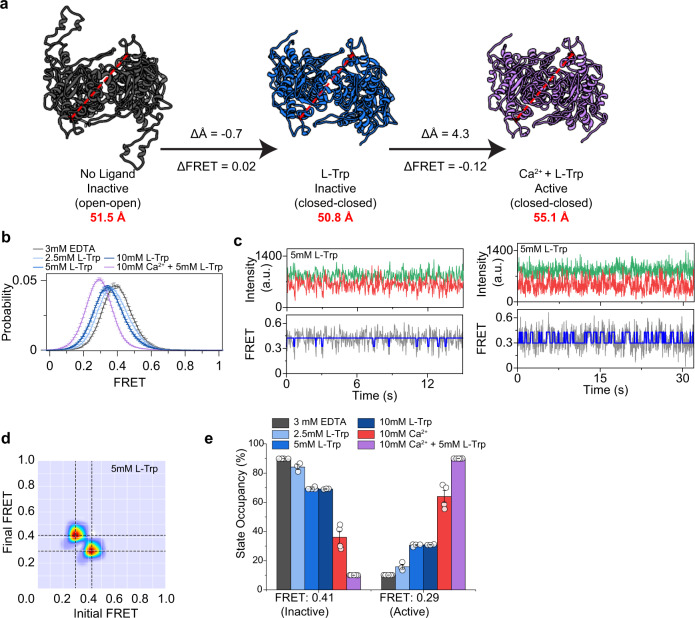
Fig. 3. l-Trp increases occupancy of the active state but is insufficient for activation.
a Top-down view of CaSR structures showing the distance between the Cα of D451 (red) for the Ioo, Icc, and Acc conformations (PDB IDs: 5K5T, 7DTU, and 7DTV, respectively). Arrows show change in distance of the D451 Cα and the corresponding predicted change in FRET. b smFRET population histogram in the presence of 3 mM EDTA, 2.5 mM l-Trp, 5 mM l-Trp, 10 mM l-Trp, or 10 mM Ca2+ and 5 mM l-Trp. Histograms for 5 mM l-Trp and 10 mM l-Trp overlap. Data represent mean ± s.e.m. of n = 3 individual independent biological replicates. c Sample single molecule traces of D451UAA in 5 mM l-Trp showing donor (green) and acceptor (red) intensities, corresponding FRET (gray), and idealized FRET trajectory from HMM fit (blue). Sample traces show particles exhibiting different behaviors in the same condition with infrequent and very brief transitions (1–2 datapoints), or frequent and brief transitions (5–10 data points). d Transition density plot of D451UAA. Dashed lines represent the most frequently observed transitions and were used for multiple-peak fitting of FRET histograms. e Occupancy of the two FRET states of the VFT in the presence of increasing ligand concentrations. Values represent mean ± s.e.m. area under individual FRET peaks from n = 3, 4, or 5 independent biological replicates.

