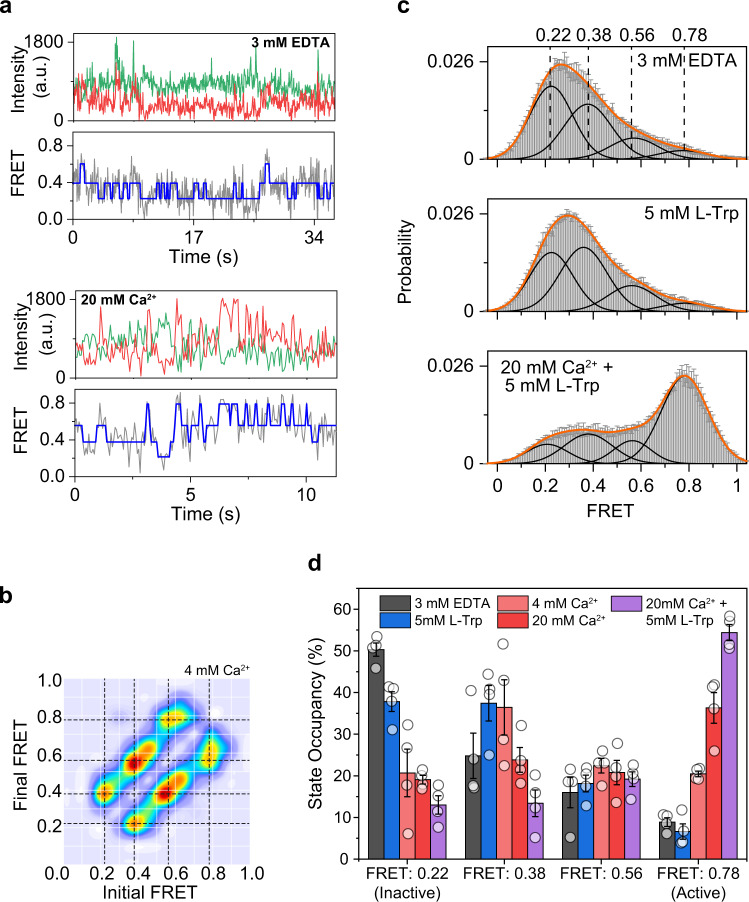
Fig. 4. CRD of CaSR is in equilibrium between four conformational states.
a Sample single molecule traces of E593UAA in 3 mM EDTA or 20 mM Ca2+ showing donor (green) and acceptor (red) intensities, corresponding FRET (gray), and idealized FRET trajectory from HMM fit (blue). b Transition density plot of E593UAA. Dashed lines represent the most frequently observed transitions and were used for multiple-peak fitting of FRET histograms. c smFRET population histogram in the presence of 3 mM EDTA, 5 mM l-Trp, or 20 mM Ca2+ and 5 mM l-Trp. Data represent mean ± s.e.m. of n = 4 independent biological replicates. Histograms were fit with four single gaussian distributions (black) centered at 0.22, 0.38, 0.56, 0.78, and the cumulative fit is overlaid (orange). d Occupancy of the four FRET states of the CRD in the presence of increasing ligand concentrations. Values represent mean ± s.e.m. area under individual FRET peaks from n = 4 independent biological replicates.

