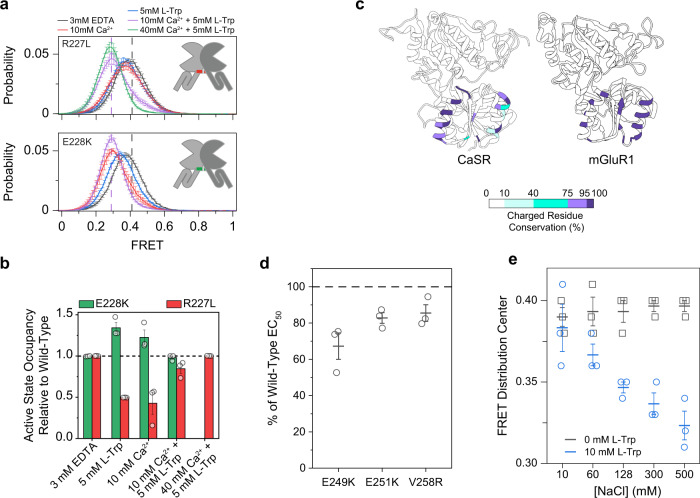
Fig. 7. Relative charge distribution of an electrostatic interface tunes calcium sensitivity of CaSR.
a smFRET population histograms of R227L and E228K in the presence of 3 mM EDTA, 5 mM l-Trp, 10 mM Ca2+, 10 mM Ca2+ and 5 mM l-Trp, or 40 mM Ca2+ and 5 mM l-Trp. For reference, dashed lines indicate centers of wild-type distributions for EDTA (gray) and 10 mM Ca2+ + 5 mM l-Trp (purple). Data represent mean ± s.e.m. of n = 3 independent biological replicates. b Occupancy of the active FRET state of R227L and E228K for each condition normalized to wild-type. Values represent mean ± s.e.m. area under active FRET peaks from smFRET population histograms, averaged over three independent biological replicates, centered at 0.41 (inactive) and 0.29 (active). 40 mM Ca2+ + 5 mM l-Trp condition was not tested for E228K c Ribbon representation of CaSR (left) and mGluR1 (right) (PDB IDs: 5K5S and 1ISR) displaying the conservation of charged residues at each position in LB2 across 200 species. d EC50 for E249K, E251K, V258R CaSR as a percentage of wild-type. Data represents the mean ± s.e.m. of n = 3 independent biological replicates. e Center of a single gaussian distribution fit to FRET histograms. Data represents the mean ± s.e.m. of n = 3 fits to independent biological replicates.

