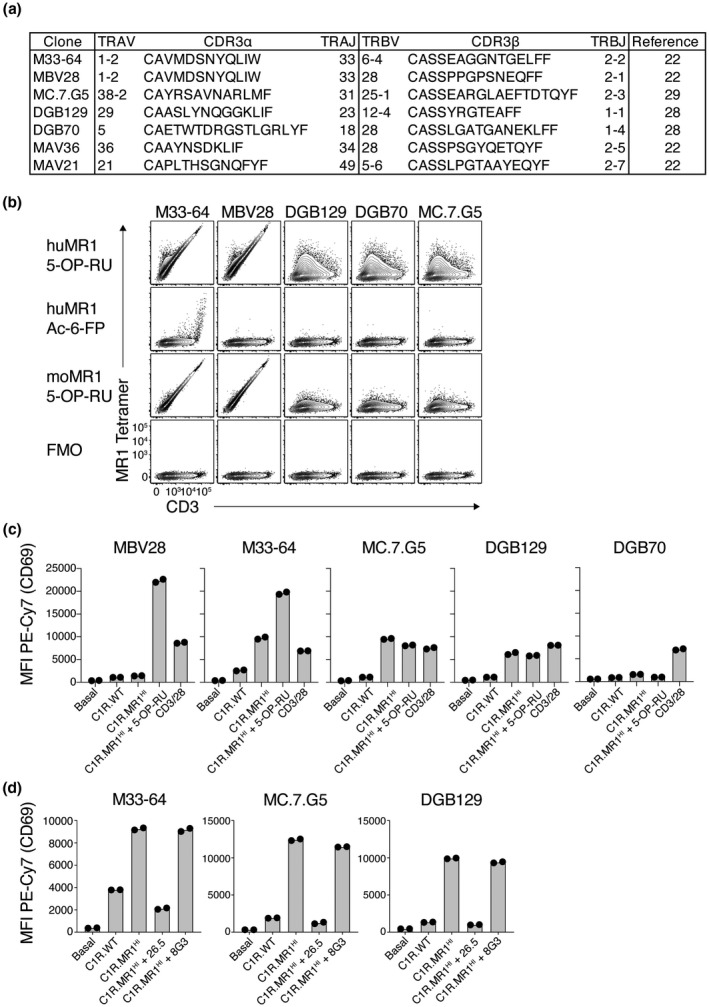
Figure 1.

MHC‐related protein 1 (MR1) reactivity by diverse T‐cell receptors (TCRs). (a) Table showing TCR sequences of clones used in this study. (b) Flow cytometric contour plots showing MR1 tetramer staining on 293T cells transiently transfected to express diverse TCRs. Plots are representative of two independent experiments. huMR1, human MR1; moMR1, mouse MR1. (c) Bar graphs showing activation of TCR‐expressing SKW‐3 cells, as measured by CD69, when cultured alone (basal) or together with C1R.WT cells, C1R.MR1HI cells, C1R.MR1HI cells plus synthetic 5‐(2‐oxopropylideneamino)‐6‐D‐ribitylaminouracil (5‐OP‐RU) ligand or CD3/CD28‐coated beads. (d) Bar graphs showing activation of TCR‐expressing SKW‐3 cells, as measured by CD69, when cultured alone or together with C1R.WT cells, C1R.MR1HI cells or C1R.MR1HI cells in the presence of MR1‐specific monoclonal antibodies 26.5 and 8G3. Data points in b and c are duplicate wells, and data are representative of two independent experiments. MFI, mean fluorescent intensity; PE, phycoerythrin; WT, wild type.
