Figure 2.

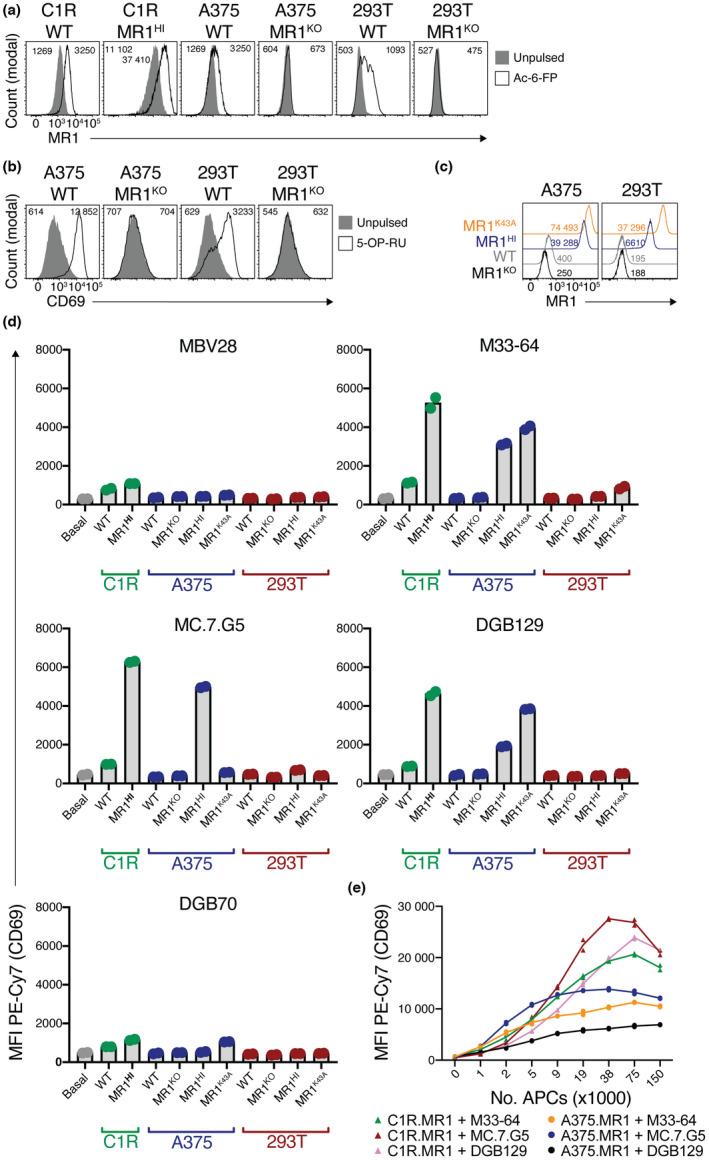
Differential dependence on K43 by different MHC‐related protein 1 (MR1)‐restricted T‐cell receptors (TCRs). (a) Histogram overlays showing MR1 expression on different antigen‐presenting cell lines when pulsed or not with 500 μm acetyl‐6‐formylpterin (Ac‐6‐FP). Numbers on plots indicate mean fluorescent intensity (MFI) of MR1 staining for unpulsed (left) or pulsed (right) cells. (b) Histogram overlays showing CD69 expression on SKW‐3.MBV28 cells when cocultured with different antigen‐presenting cell lines when pulsed or not with synthetic 5‐(2‐oxopropylideneamino)‐6‐D‐ribitylaminouracil (5‐OP‐RU). Numbers on plots indicate MFIs of CD69 as per a. (c) Histogram overlays showing MR1 expression on variant A375 or 293T cells. Numbers on plots depict MFIs of MR1. (d) Bars graphs showing activation of TCR‐expressing SKW‐3 cells, as measured by CD69, after coculture with a panel of antigen‐presenting cell lines. (e) Line graphs showing activation of SKW‐3 cell lines in response to titrated numbers of A375.MR1 or C1R.MR1 cells. a–e are representative of two independent experiments each. Data points in d and e are replicate wells and graphs are representative of three and two independent experiments, respectively. MFI, mean fluorescent intensity; PE, phycoerythrin; WT, wild type.
