Figure 3.

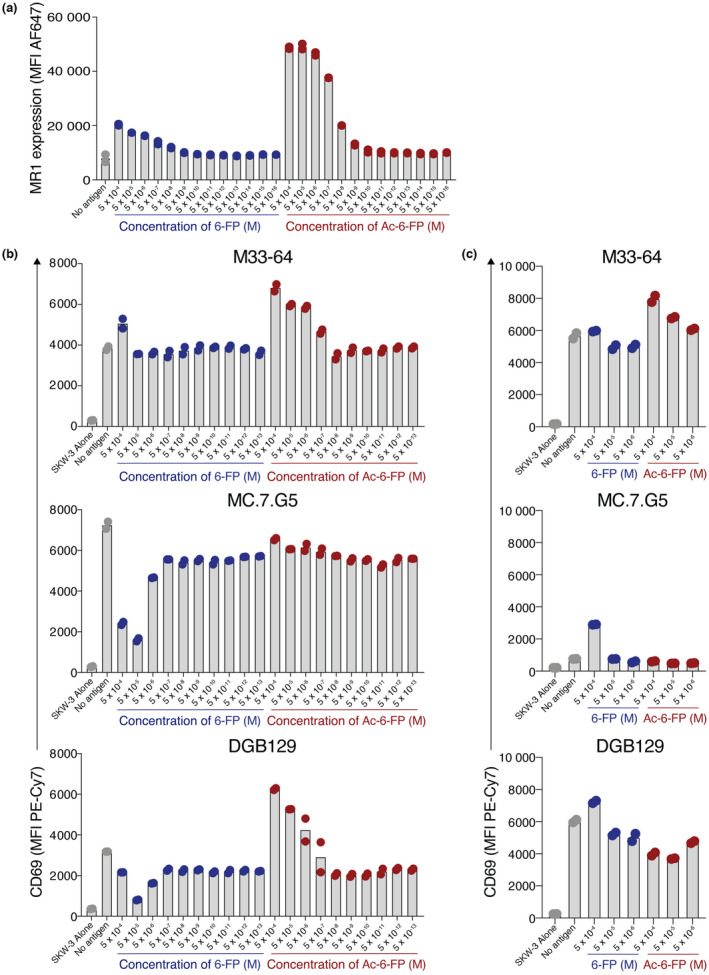
Differential effects on activation by 6‐formylpterin (6‐FP) and acetyl‐6‐FP (Ac‐6‐FP). (a) Bar graphs showing the mean fluorescence intensity (MFI) of MHC‐related protein 1 (MR1) expression on A375.MR1HI cells when pulsed with titrating concentrations of 6‐FP or Ac‐6‐FP. (b, c) Bar graphs showing activation of T‐cell receptor (TCR)‐expressing SKW‐3 cells as measured by CD69, after coculture with, (b) A375.MR1HI cells or (c) A375.MR1K43A cells, with titrating doses of 6‐FP or Ac‐6‐FP. Points on all plots are replicate wells, and data are representative of two independent experiments. PE, phycoerythrin.
