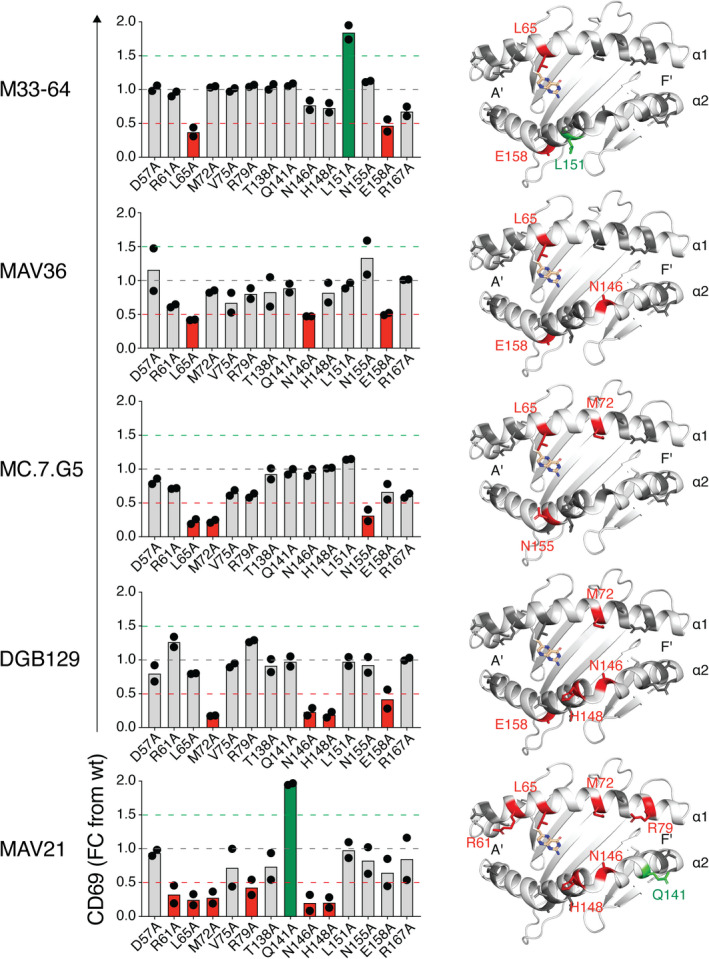
Figure 5.

Analysis of docking modes by diverse MHC‐related protein 1 (MR1)‐restricted T‐cell receptors (TCRs). Left: Bar graphs showing activation of TCR‐expressing SKW‐3 cells as measured by CD69, after coculture with a panel of C1R cell lines expressing MR1 alanine point mutants. Points on plots are the mean of replicates from two independent experiments. Right: Cartoon representations of the top–down view of the α1 and α2 domains of MR1 (PDB: 4GUP), showing the amino acid residues that impact binding.
