. 2021 Jun 4;11(33):20003–20005. doi: 10.1039/d1ra90123k

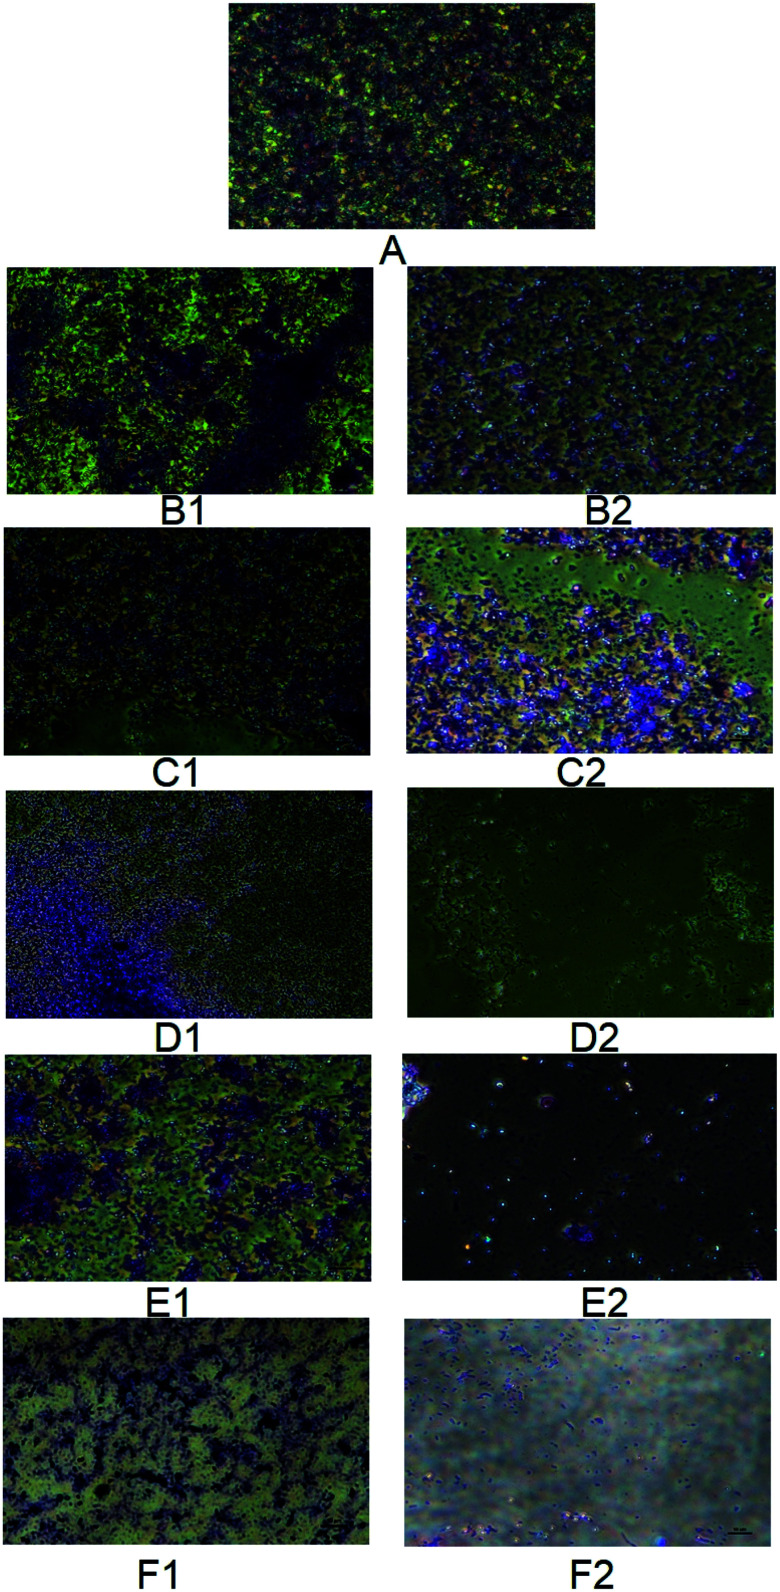
Fig. 7. Phase contrast micrographs showing biofilm disruption potential of MSI12-EPS on C. albicans. The C. albicans biofilm was developed on a cover glass and then it was treated with varying concentrations of EPS and fluconazole ranging from 50–250 μg. The treated cover glass was stained with crystal violet and observed under a phase-contrast microscope (Nikon) at ×40 magnification. A – Control biofilm, B1 – 50 mg fluconazole, B2 – 50 μg MSI12-EPS, C1 – 100 mg fluconazole, C2 – 100 μg MSI12-EPS, D1 – 150 mg fluconazole, D2 – 150 μg MSI12-EPS, E1 – 200 mg fluconazole, E2 – 200 μg MSI12-EPS and F1 – 250 mg fluconazole, F2 – 250 μg MSI12-EPS. The images were recorded using a uniform scale of 10 μm which is shown in the image panels.

Fig. 7