. 2021 Jun 7;11(33):20326–20334. doi: 10.1039/d1ra01957k

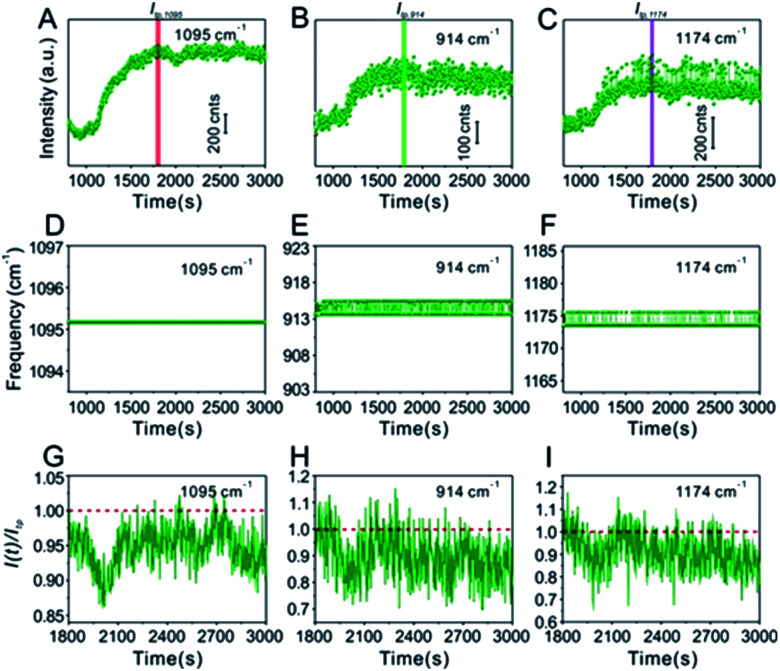
Fig. 4. (A) Time-ordered Raman spectra of the IS 4-Mpy at the 1095 cm−1 peak in the glycerol-assisted liquid film protection system. The corresponding time evolution of the frequency of the (D) 1095 cm−1 peak. (G) The change of signal intensity I(t) at 1095 cm−1 after achieving optimal hotspots compared to the maximum enhancement Itp (the tipping point is indicated by the red bar in (A)). (B and C) Time-ordered Raman spectra of 10−7 M CV at 914 cm−1 and 1174 cm−1, respectively. The corresponding time evolution of the frequencies of the (E) 914 cm−1 peak and the (F) 1174 cm−1 peak. (H and I) The change of signal intensity I(t) at 914 cm−1 and 1174 cm−1 after reaching optimal hotspots compared to the maximum enhancement Itp (the corresponding tipping points are indicated by the green bar in (B) and purple bar in (C)).

Fig. 4