. 2021 Jun 7;11(33):20326–20334. doi: 10.1039/d1ra01957k

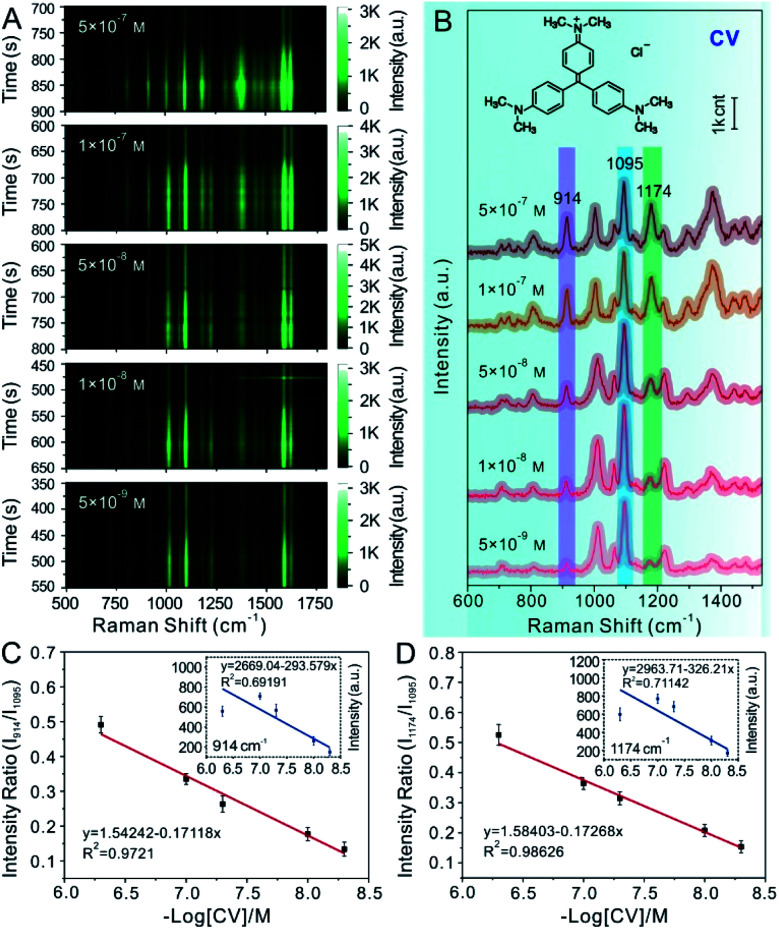
Fig. 5. (A) Time-ordered Raman spectra of various concentrations of CV using the 3D hotspot matrix SERS platform constructed with the assistance of 2.5% v/v glycerol. (B) The SERS spectra of various concentrations corresponding to the yellow labelled part in (A). (C) Calibration plot based on the Raman intensity of I914/1095vs. −log[CV]. The inset is a fitting plot based on Raman intensity at I914vs. −log[CV]. (D) Calibration plot based on the Raman intensity of I1174/1095vs. −log[CV]. The inset is a fitting plot based on Raman intensity at I1174vs. −log[CV]. Error bars signify the RSD of 11 spectra collected continuously for 20 s after the occurrence of the optimal hotspots.

Fig. 5