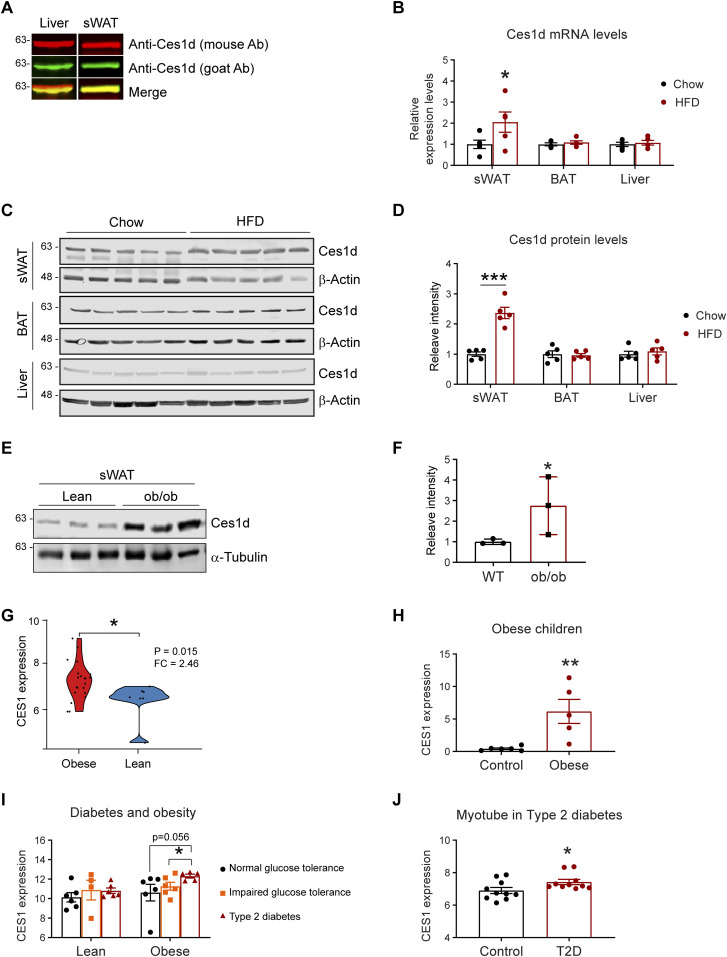
Figure 1. The levels of Ces1d increase in adipose tissues during obesity.
(A) Western blotting (WB) analysis of Ces1d in 50 μg proteins of the tissue lysates collected from the liver and subcutaneous white adipose tissue (sWAT) of the C57BL/6J wild-type (WT) mice using mouse α-Ces1d antibody (red) and goat α-Ces1d antibody (green). (B) Comparison of the mRNA levels of Ces1d by qPCR in the samples of sWAT, brown adipose tissue (BAT), and liver collected from WT mice fed by regular chow or high fat diet (HFD) for 14 wk (n = 5 per group, each point represents a biology replicate, representative of three repeats). Data are represented as mean ± SEM, t test, *P < 0.05. (C) WB analysis of Ces1d in the lysates from the sWAT from WT mice fed by regular chow or HFD for 14 wk. β-Actin was used as loading controls (n = 5 per group, representative of three repeats). (D) Quantification of the band intensity for Ces1d in (c) by ImageJ (n = 5 per group, each point represents a biology replicate). Data are represented as mean ± SEM, t test, ***P < 0.001. (E) WB analysis of Ces1d in the lysates from the sWAT from ob/ob mice fed by regular chow for 14 wk. α-Tubulin was used as loading controls (n = 3 per group, representative of three repeats). (F) Quantification of the band intensity for Ces1d in (c) by ImageJ (n = 3 per group, each point represents a biology replicate). Data are represented as mean ± SEM, t test, *P < 0.05. (G) The CES1 expression levels in the adipose tissues from morbidly obese patients or controls. The data was obtained from the Gene Expression Omnibus database (GDS3679). n = 7–21 per group. (H) The CES1 expression levels in adipose tissues from the obese and normal-weight prepubertal children (GDS3688). n = 5∼6 per group. (I) The CES1 expression levels in adipose tissues from the lean or obese subjects with normal, impaired glucose tolerance, or type 2 diabetes (GDS3961). n = 4–6 per group. (J) The CES1 expression levels in the myotube cell lines established from type 2 diabetes (T2D) or control subjects (GDS3681). n = 10 per group.
Source data are available for this figure.

