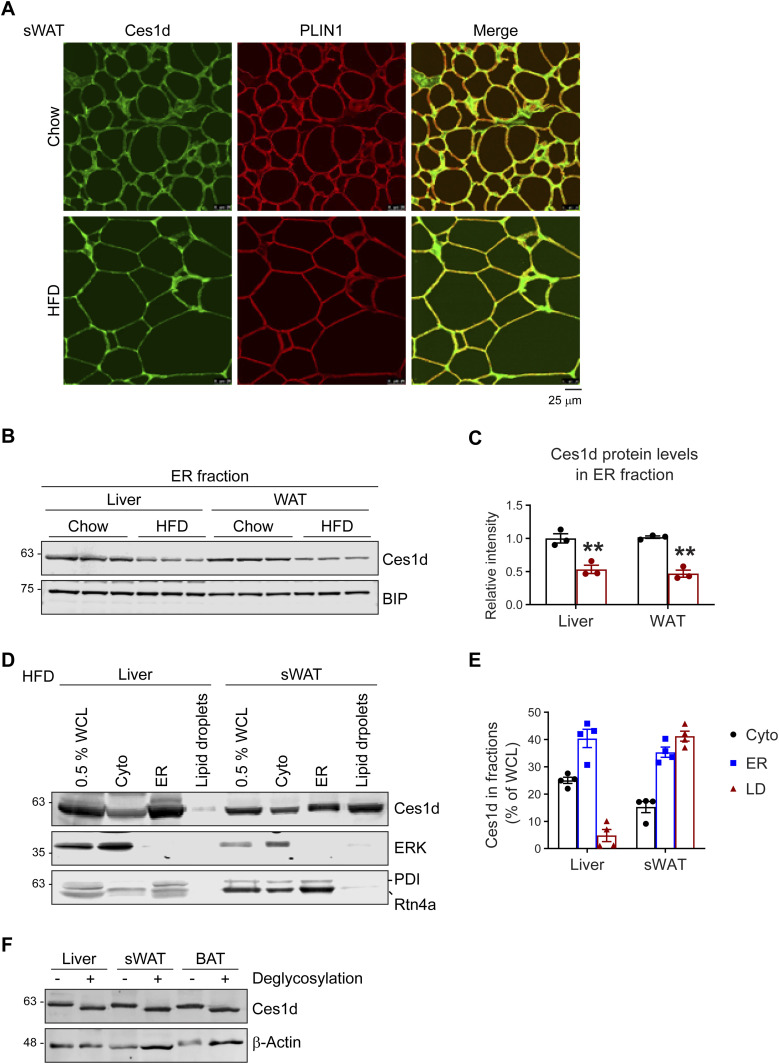
Figure 2. Ces1d localizes on both ER and lipid droplets in adipose tissue.
(A) Co-immunofluorescence (Co-IF) staining with α-Ces1d (green) and α-Perilipin-1 (PLIN1, red) (lipid droplet marker protein) antibodies on the sWAT from WT mice fed by regular chow or HFD (representative of six fields, experiments were repeated for three times). Scale bars: 25 μm. (B) WB analysis of Ces1d in the ER fractions isolated from the liver and WAT from WT mice fed by regular chow or HFD. BIP was used as the loading control for the ER fraction (n = 3 per group, representative of three repeats). (B, C) Quantification of the band intensity for Ces1d in (B) (n = 3 per group, each point represents a biology replicate). Data are represented as mean ± SEM, t test, **P < 0.01. (D) WB analysis of Ces1d in different cell fractions, including whole cell lysates (WCL), cytoplasm (Cyto), ER, and lipid droplets of the liver and sWAT from the wild-type mice. ERK was used as the loading control for cytosolic proteins, whereas PDI and Rtn4a were used as the loading controls for the ER proteins. 0.5% of the total WCL, 1% of the Cyto, ER, and lipid droplets extracts were loaded (representative of three repeats). (D, E) Quantification of the band intensity for Ces1d in (D) (n = 4 per group, each point represents a biology replicate). Data are represented as mean ± SEM. (F) WB analysis of Ces1d in the lysates from the liver, sWAT, and BAT from WT mice. The samples were pretreated with de-glycosylation enzymes to remove both O- and N-glycans before the analysis.

