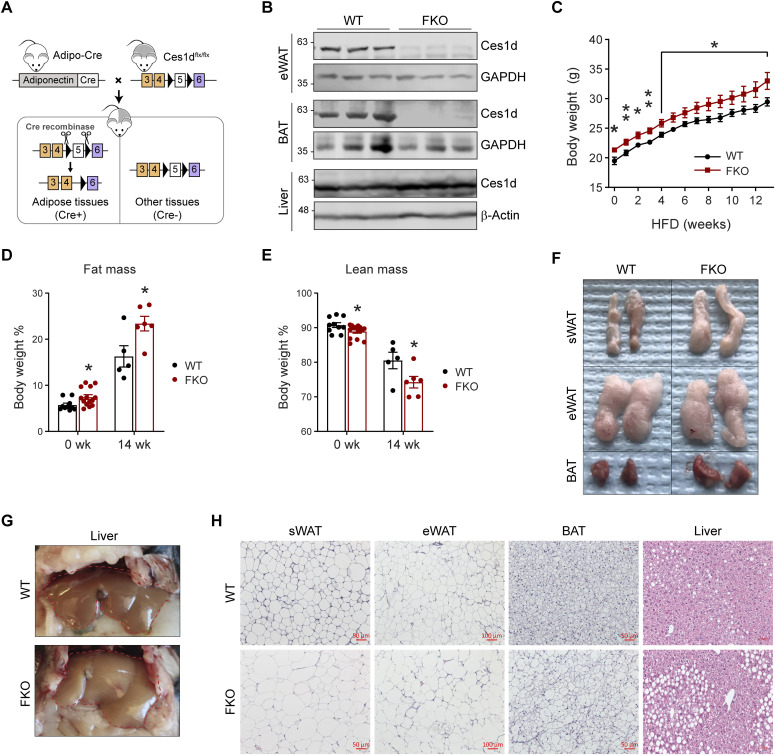
Figure 4. Adipose tissue–specific Ces1d knockout (FKO) mice gain more body weights with larger fat masses and fatty liver.
(A) Schematic representation of adipocyte-specific Ces1d knockout (Adipo-Cre;Ces1dflx/flx) mouse model. (B) WB analysis for Ces1d in the lysates from epididymal WAT (eWAT), BAT, and liver of the FKO and their littermate control WT mice. GAPDH was used as the loading control for eWAT and BAT, whereas β-actin for liver. (n = 3 per group, representative of three repeats). (C) Body weights of the WT and FKO mice during a 14-wk HFD feeding (n = 5 in WT group and n = 10 in FKO group, each point represents a biology replicate, representative of three repeats). Data are represented as mean ± SEM, t test, *P < 0.05, **P < 0.01. (D, E) Fat mass (D) and lean mass (E) of the WT and FKO mice with or without HFD feeding (n = 5–14, each point represents a biology replicate, representative of three repeats). Data are represented as mean ± SEM, t test, *P < 0.05. (F) Images of biopsies of the sWAT, eWAT, and BAT from WT and FKO mice after 14-wk HFD feeding (representative of five mice per group). (G) Images of biopsies of the liver from WT and FKO mice after 14-wk HFD feeding (representative of five mice per group). (H) H & E staining for the sWAT, eWAT, BAT, and liver from WT and FKO mice after 14-wk HFD feeding (representative of five fields of the samples from five mice per group). Scale bars: 50, 100 μm in eWAT.
Source data are available for this figure.

