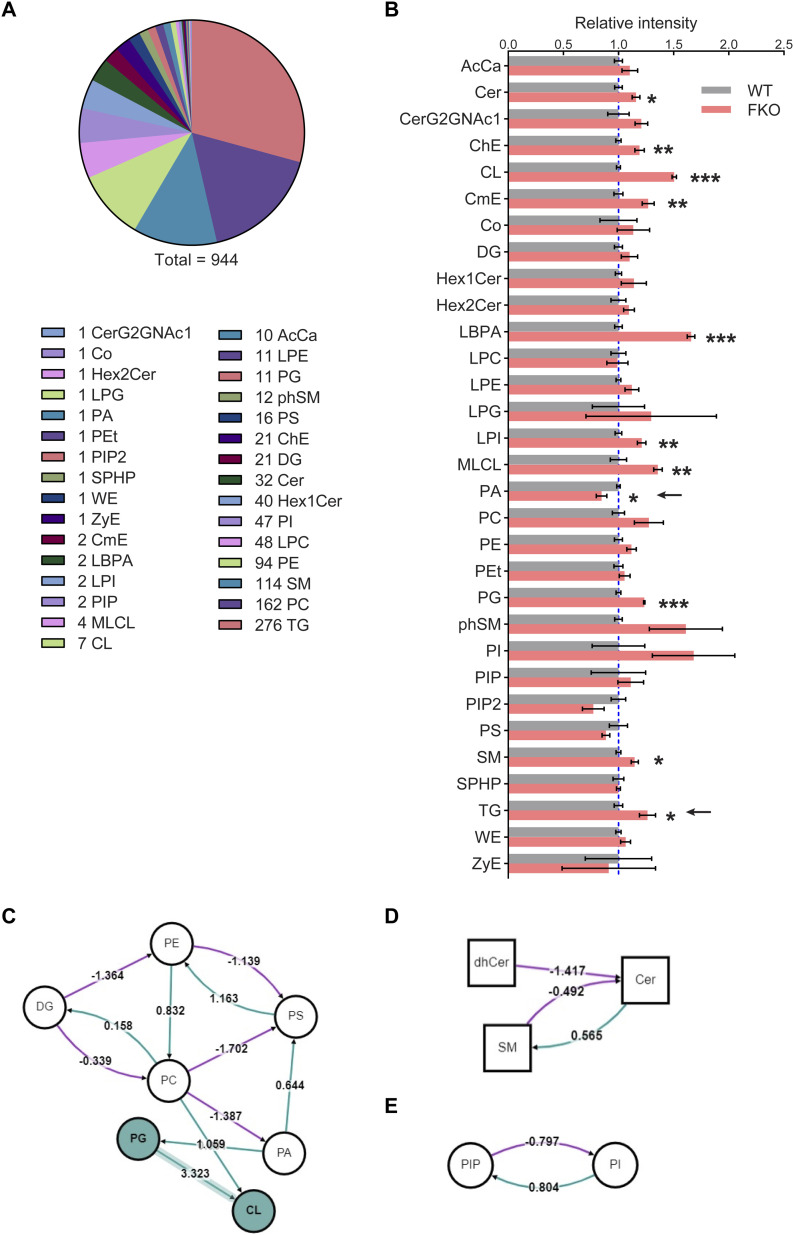
Figure 7. Lipid profiling in the serum of FKO and WT mice upon HFD challenge by lipidomics.
(A) Total 944 different lipids were detected by the lipidomic analysis in the serum from WT and FKO mice fed on HFD for 14 wk (n = 3 per group; for each sample, sera from two or three mice were pooled). (B) The relative intensities of the lipid species for the lipidomic analysis in the serum from WT and FKO mice fed on HFD (n = 3 per group; for each sample, sera from two or three mice were pooled). Data are represented as mean ± SEM, t test *P < 0.05; **P < 0.01; ***P < 0.001. (C, D, E) The lipid metabolic pathway analysis using all the detected molecules from lipidomics. Node shape: circle, glycerolipids and glycerophospholipids (including DG, PE, PS, PC, PA, PG, CL, PIP, and PI); square, sphingolipids (including dhCer, Cer, and SM). Edge color: pink means negative regulation, whereas green means positive regulation.
Source data are available for this figure.

