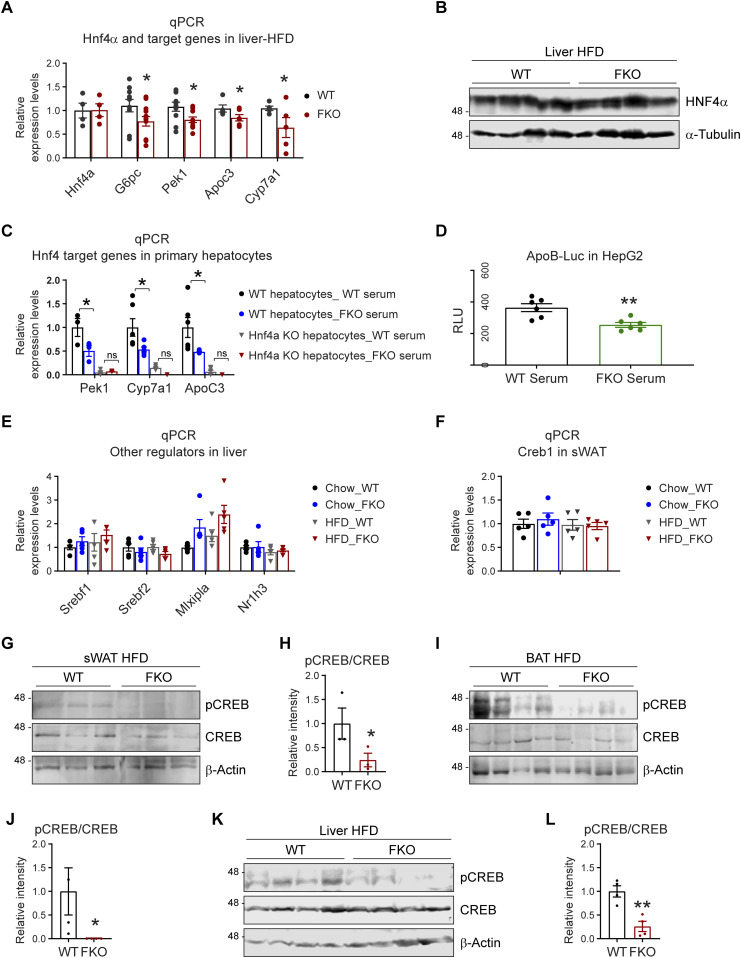
Figure 9. Deficiency of Ces1d in adipose tissue leads to epigenetic regulations of the metabolic genes.
(A) qPCR analysis for the mRNA levels of Hnf4α and its target genes including G6pc, Pck1, Apoc3, and Cyp7a1 in the liver of WT and FKO mice fed on HFD (n = 5–10 per group, each point represents a biology replicate, representative of three repeats). Data are represented as mean ± SEM, one-way ANOVA, *P < 0.05. (B) WB analysis of HNF4α in the lysates from the liver of WT and FKO mice fed on HFD. Tubulin-α was used as loading control (n = 4 per group, representative of three repeats). (C) qPCR analysis for the mRNA levels of Hnf4α target genes including Pck1, Cyp7a1, and Apoc3 in the primary hepatocytes of WT or liver-specific Hnf4 knockout mice treated by the serum from WT or FKO mice (n = 3–6 per group, each point represents a biology replicate, representative of three repeats). Data are represented as mean ± SEM, t test, *P < 0.05, n.s, no significance. (D) Analysis of luciferase reporter activity for HNF4α in HepG2 cells treated by the serum from WT or FKO mice. RLU, relative light units (n = 6 per group, each point represents a biology replicate, representative of three repeats). Data are represented as mean ± SEM, t test, **P < 0.01. (E) qPCR analysis for the mRNA levels of Srebf1, Srebf2, Mlxipl, and Nr1h3 in the liver of WT and FKO mice fed on regular chow or HFD (n = 5 per group, each point represents a biology replicate, representative of three repeats) Data are represented as mean ± SEM, one-way ANOVA. (F) qPCR analysis for Creb1 mRNA in the sWAT of WT and FKO mice fed on regular chow or HFD (n = 5 per group, representative of three repeats). Data are represented as mean ± SEM, one-way ANOVA. (G) WB analysis of pCREB and CREB in the lysates from the sWAT of WT and FKO mice fed on HFD. β-Actin was used as loading control (n = 3 per group, representative of three repeats). (G, H) Quantification of the band intensity for pCREB/CREB ratio in (G) (n = 3 per group, each point represents a biology replicate). Data are represented as mean ± SEM, t test, *P < 0.05. (I) WB analysis of pCREB and CREB in the lysates from the BAT of WT and FKO mice fed on HFD. β-Actin was used as loading control (n = 4 per group, representative of three repeats). (I, J) Quantification of the band intensity for pCREB/CREB ratio in (I) (n = 4 per group, each point represents a biology replicate). Data are represented as mean ± SEM, t test, *P < 0.05. (K) WB analysis of pCREB and CREB in the lysates from the liver of WT and FKO mice fed on HFD. β-Actin was used as loading control (n = 4 per group, representative of three repeats). (K, L) Quantification of the band intensity for pCREB/CREB ratio in (K) (n = 4 per group, each point represents a biology replicate). Data are represented as mean ± SEM, t test, **P < 0.01.

