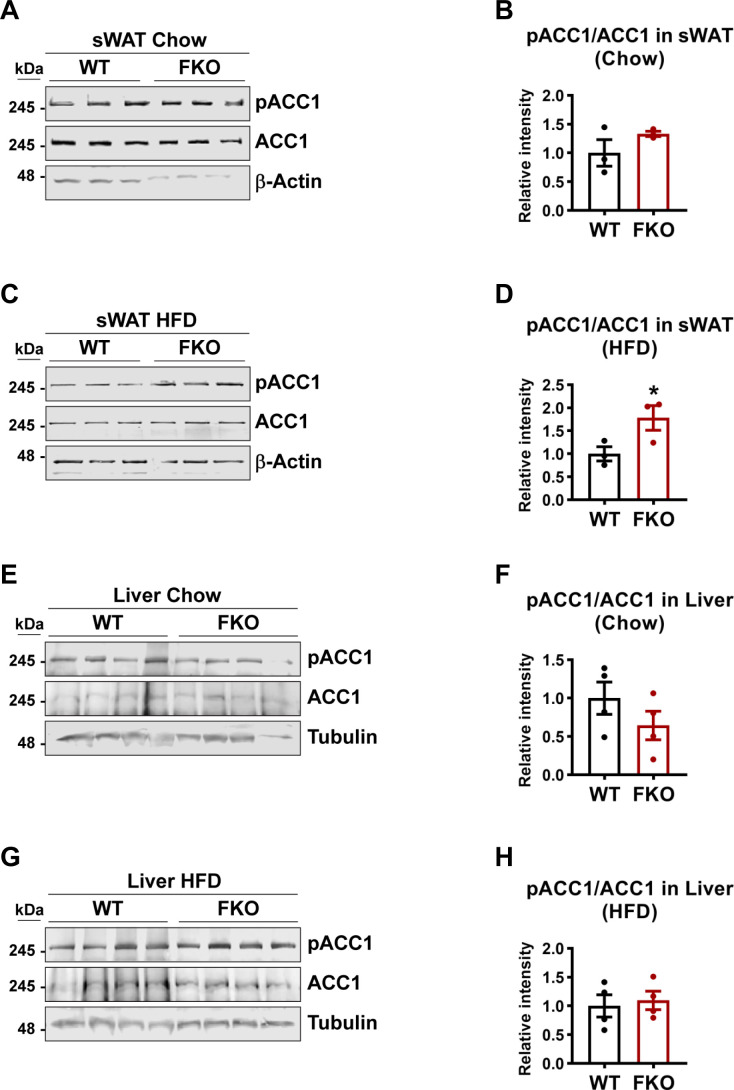
Figure S2. WB analysis of pACC1 and ACC1 in the lysates from the metabolic tissues of WT and FKO mice.
(A) WB analysis of pACC1 and ACC1 in the lysates from the sWAT of WT and FKO mice fed on regular chow. Actin was used as loading control (n = 3 per group, representative of three repeats). (A, B) Quantification of the band intensity of pACC1/ACC1 ratio in (A) (n = 3 per group, each point represents a biology replicate). Data are represented as mean ± SEM, t test. (C) WB analysis of pACC1 and ACC1 in the lysates from the sWAT of WT and FKO mice fed on HFD. Actin was used as loading control (n = 3 per group, representative of three repeats). (C, D) Quantification of the band intensity of pACC1/ACC1 ratio in (C) (n = 3 each point represents a biology replicate). Data are represented as mean ± SEM, t test, *P < 0.05. (E) WB analysis of pACC1 and ACC1 in the lysates from the liver of WT and FKO mice fed on regular chow. Tubulin was used as loading control (n = 4 per group. representative of three repeats). (E, F) Quantification of the band intensity of pACC1/ACC1 ratio in (E) (n = 4 per group, each point represents a biology replicate). Data are represented as mean ± SEM, t test. (G) WB analysis of pACC1 and ACC1 in the lysates from the liver of WT and FKO mice fed on HFD. Tubulin was used as loading control (n = 4 per group, representative of three repeats). (G, H) Quantification of the band intensity of pACC1/ACC1 ratio in (G) (n = 4 per group, each point represents a biology replicate). Data are represented as mean ± SEM, t test.
Source data are available for this figure.

