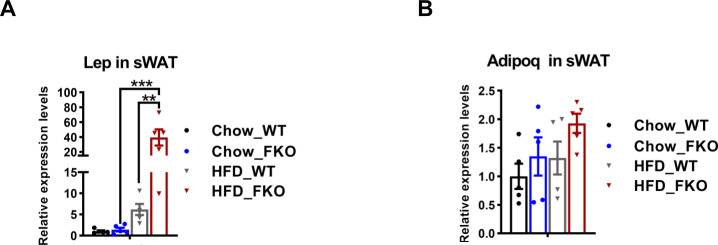
Figure S4. Expression levels of leptin and adiponectin in the WT and FKO mice.
(A) qPCR analysis for Lep in the sWAT from WT and FKO mice fed on regular or HFD (n = 5 -10 per group, each point represents a biology replicate, representative of three repeats). Data are represented as mean ± SEM, one-way ANOVA, **P < 0.01, ***P < 0.001. (B) qPCR analysis for Adipoq mRNA level in the sWAT from WT and FKO mice fed on regular chow or HFD. (n = 5 in each group, each point represents a biology replicate, representative of three repeats). Data are represented as mean ± SEM, one-way ANOVA.

