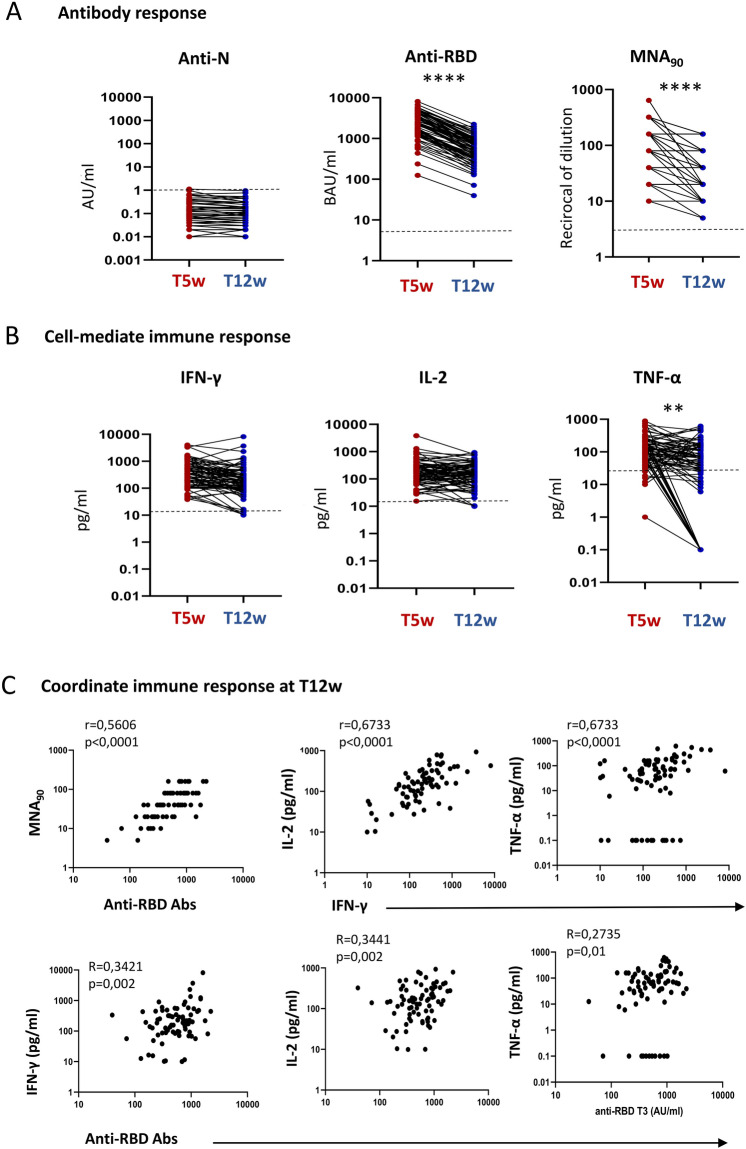
Figure 1.
(A) Humoral response 5 (T5w) and 12 (T12w) weeks after vaccination. SARS-CoV-2 specific anti-N, anti-RBD and neutralizing Abs were quantified in sera samples at both time points. Anti-N-IgG are expressed as index values S/CO and values ≥ 1.4 are considered positive; Anti-RBD-IgG are expressed as Binding Arbitrary Units (BAU)/mL and values ≥ 7.1 are considered positive; neutralizing Abs are expressed as the highest serum reciprocal of dilution inhibiting at least 90% of the cytopathic effect (MNA90), values ≥ 10 are considered positive. (B) Cell-mediated immune response 5 (T5w) and 12 (T12w) weeks after vaccination. Cytokines (IFN-γ, TNF-α, IL-2) were quantified in stimulated blood samples at both time points and showed after subtracting the background. Dashed line identify the cut-off of each test calculated as the mean ± 2SEM of 55 anti-S and anti-N negative HCW before vaccination. Differences between the median in T5w and T12w were calculated by paired t test. ****p < 0.0001; *p < 0.5. (C) Correlation between humoral and cell-mediated immune response 12 (T12w) weeks after vaccination. Correlations within humoral levels (anti-RBD and MNA90), within cell-mediated response (IFN-γ, TNF-α and IL-2) and across humoral and cell-mediated immunity (anti-RBD and IFN-γ, TNF-α and IL-2) are shown. Correlation was analyzed by Spearmen test. Comparison of medians across groups were evaluated by Wilcoxon test for pairwise comparisons. Correlations between assays were assessed by non-parametric Spearman's rank tests. A 2-sided P value < 0.05 was considered statistically significant.

