Figure 3.
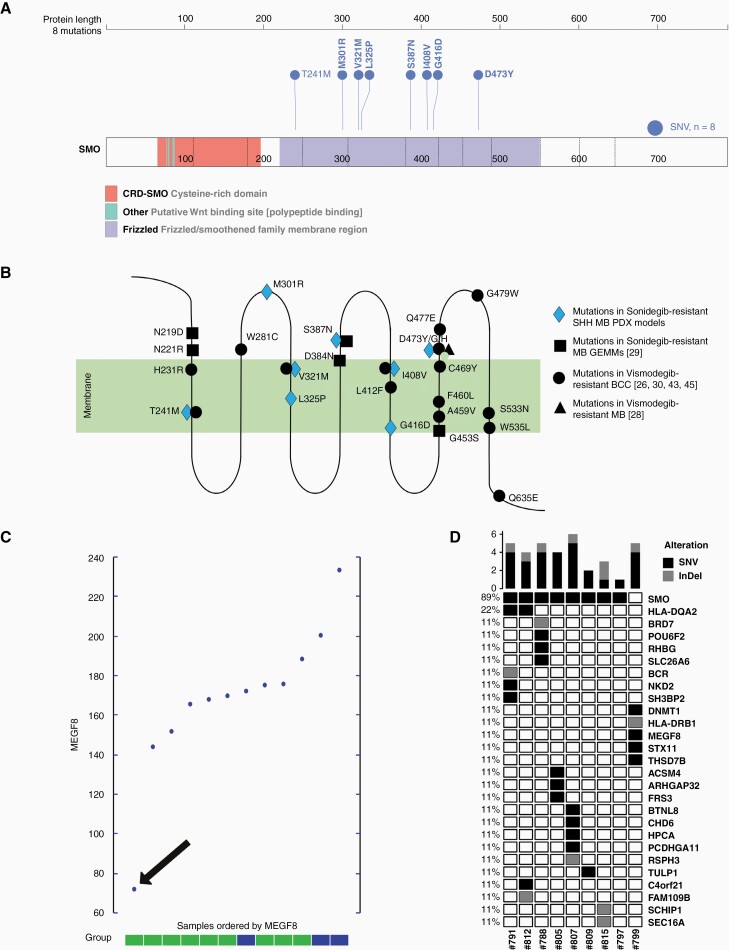
Genomic analysis of generated resistant samples reveals mutations in SMO and mutation in MEGF8. A) protein sequence showing different regions of SMO and eight different mutations discovered in the resistant SHH MB PDX models (visualized by using ProteinPaint; https://proteinpaint.stjude.org/; 46); B) schematic visualization of SMO with cytoplasmic, transmembrane and extracellular areas as well as localizations of the eight mutations detected in the resistant clones indicated in blue; mutations detected in previously published studies are shown in black; C) expression levels of MEGF8 for the nine resistant samples (green) and three vehicle samples (blue); sample with MEGF8-mutation is highlighted with a black arrow; D) Oncoplot showing all SNVs and InDels analyzed in the generated resistant models when compared to the original model used for injection.

