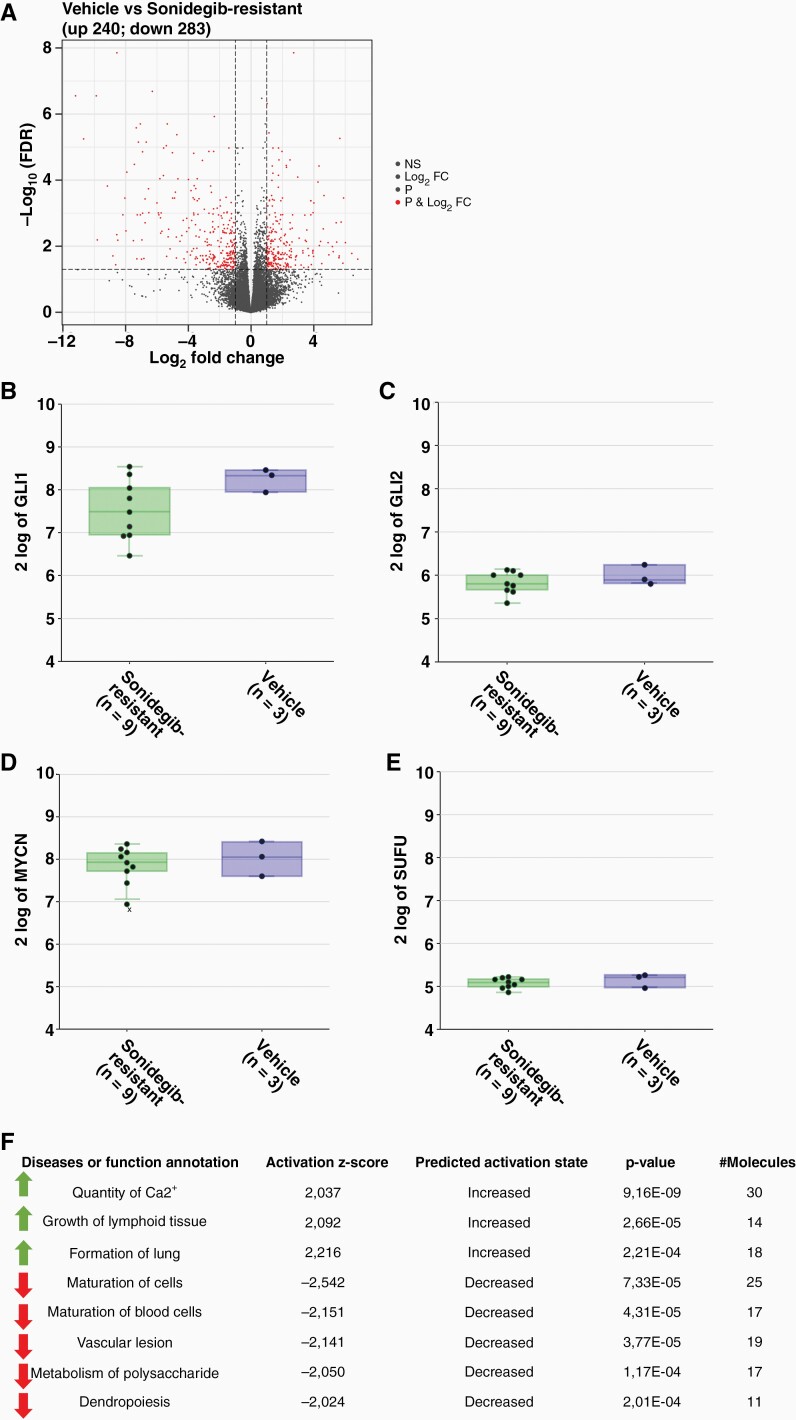
Figure 4.
Differential expression of genes of in resistant models shows re-activation of SHH pathway in resistant samples. A) RNA-seq analysis of vehicle and resistant samples showing up- (240) and downregulated (283) genes; expression levels of GLI1 (B), GLI2 (C), MYCN (D) and SUFU (E) of vehicle-treated (n = 3) and resistant models (n = 9) do not show differences; F) IPA analysis of pathways increased and decreased in resistant samples compared to vehicle samples does not reveal pathways related to (cancer) cell proliferation or tumor growth.

