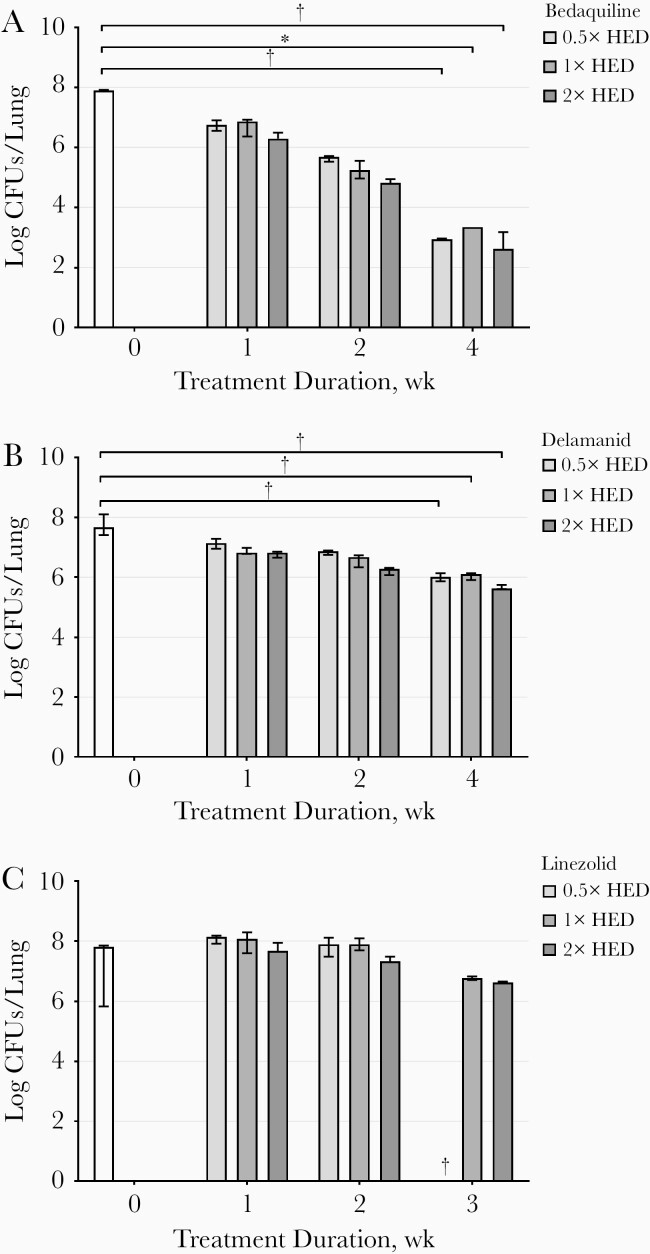
Figure 2.
Mycobacterial load in lungs expressed as median and range (error bars) of the colony-forming units (CFUs) (n = 3), at weeks 0, 1, 2, and 3 or 4 weeks after treatment with bedaquiline (A), delamanid (B), or linezolid (C). White bars represent control mice; bars from light to dark gray represent mice treated with 0.5×, 1×, and 2× the human pharmacokinetic equivalent dose (HED). *P < .01; **P < .001 (1-way analysis of variance). †Three mice were euthanized before planned as humane end points had been reached. Results for 1 mouse treated with 0.5×, 2 treated with 1×, and 1 treated with 2× the HED for bedaquiline are missing in week 4, since no undiluted samples were analyzed and 10× diluted samples of lungs and spleen did not show any CFUs.

