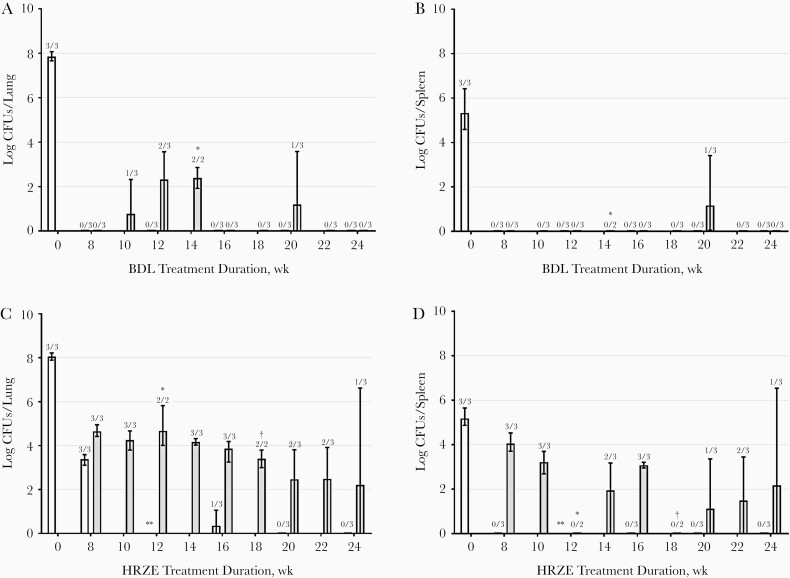
Figure 3.
Mycobacterial load in lung (A, C) and spleen (B, D) expressed as medians and ranges (error bars) of the colony-forming units (CFUs) per organ. Results at weeks 8, 12, 16, 20, and 24 of treatment are expressed as white bars, and relapse assessment was performed 12 weeks after a treatment duration of 8, 10, 12, 14, 16, 18, 20, 22, and 24 weeks, expressed as gray bars. Mice were treated with bedaquiline, delamanid, and linezolid (BDL) (A, B) or isoniazid, rifampicin, pyrazinamide, and ethambutol (HRZE) (C, D). Numbers above bars are the numbers of culture-positive mice of total numbers of mice at that time point. *CFU counting was not performed since the culture plates were contaminated. †One mouse reached humane end points before planned euthanasia.

