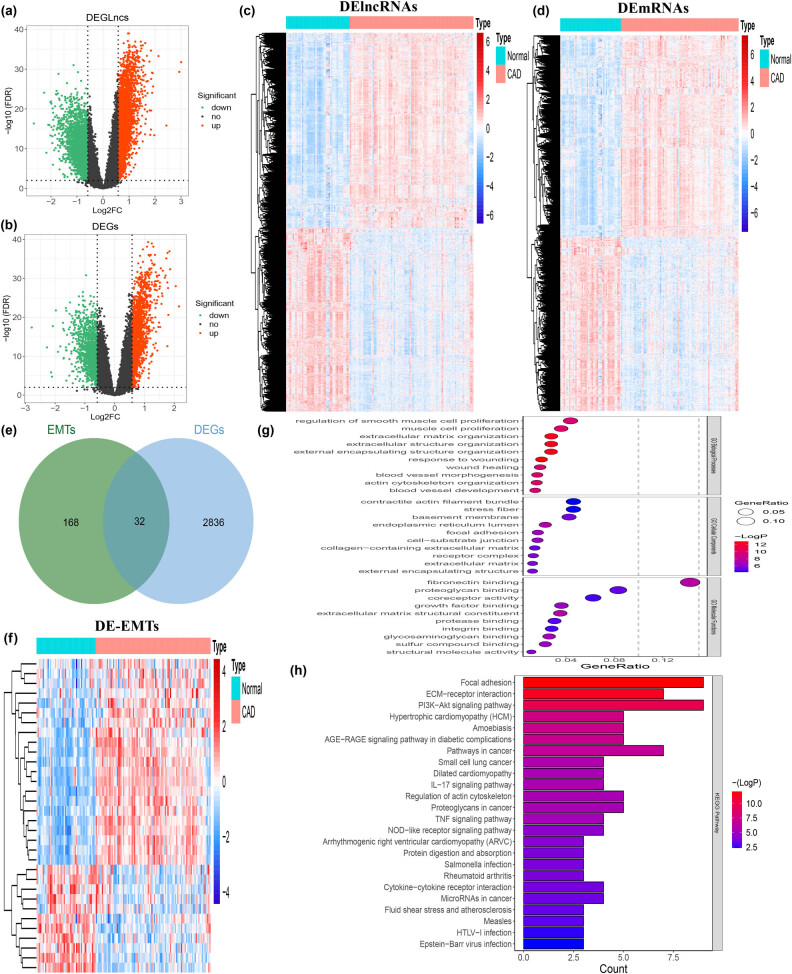
Figure 1.
Identification of DE-EMTs in CAD. (a) Volcano plot of lncRNAs expression between CAD and normal groups. (b) Volcano plot of mRNAs expression between CAD and normal groups. (c) Heatmap of DElncRNAs between CAD and normal groups. (d) Heatmap of DEGs between CAD and normal groups. (e) Venn diagram was used for the intersection of DEGs and EMT genes. (f) Heatmap of DE-EMTs between CAD and normal groups. (g) GO enrichment analysis of DE-EMTs: the larger the bubble and longer columns represent the more genes enriched in this function, the deeper the color of the bubble and bars, the smaller the P value. (h) KEGG enrichment analysis of DE-EMTs.

