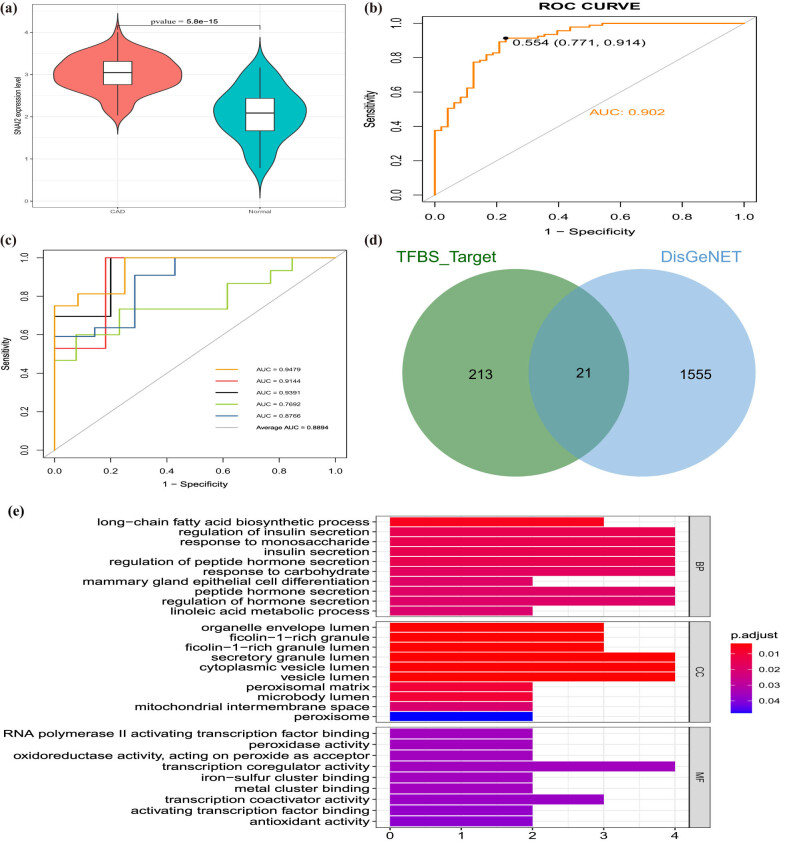
Figure 5.
Clinical performance of SNAI2 in CAD. (a) SNAI2 is highly expressed in CAD groups and low in normal groups. (b) ROC analysis results for SNAI2 in CAD. (c) The ROC curve of predicted outcomes of SNAI2 diagnostic signature by a logistic regression model. (d) Venn diagram of 21 CAD-related genes regulated by SNAI2. (e) GO enrichment analysis of 21 CAD-related genes regulated by SNAI2.

