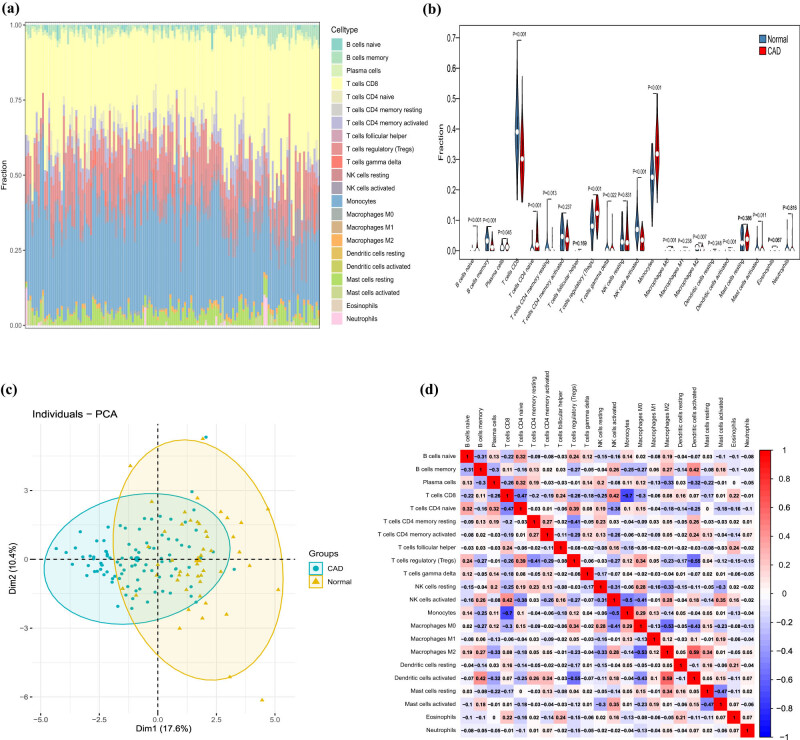
Figure 6.
Evaluation and visualization of immune cell infiltration by CIBERSORT algorithm. (a) Immune cell types and ratios of CAD groups. (b) Violin plot comparing immune cell compositions between CAD groups and normal groups. (c) PCA for immune cell compositions between CAD groups and normal groups. (d) Pearson correlation heatmap between infiltrating immune cell subpopulations.

