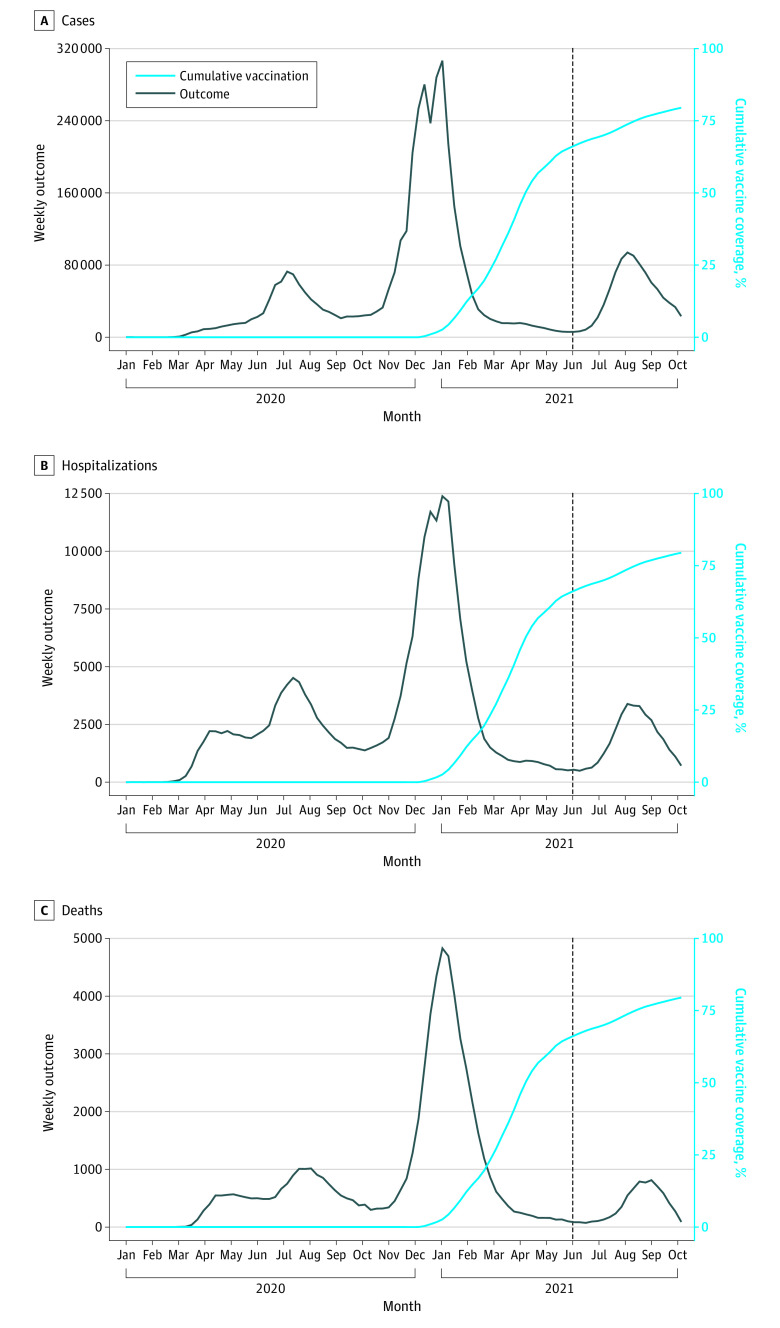
Figure 1. COVID-19 Cases, Hospitalizations, Deaths, and Vaccination Over Time in California.
Data on COVID-19 cases were obtained from the California Department of Public Health for the period of January 1, 2020, to October 16, 2021. Weekly absolute cases (A), hospitalizations (B), and deaths (C) were plotted (black line). Cumulative coverage of COVID-19 vaccination in the population aged 12 years or older was plotted (light blue line) using publicly available data from November 29, 2020, to October 16, 2021. Date of vaccination was defined as the date of first vaccine dose receipt in persons who received at least 1 dose of a COVID-19 vaccine (BNT162b2, mRNA-1273, or Ad26.COV2.S). The dashed line (black) represents the introduction of the Delta variant in California.

