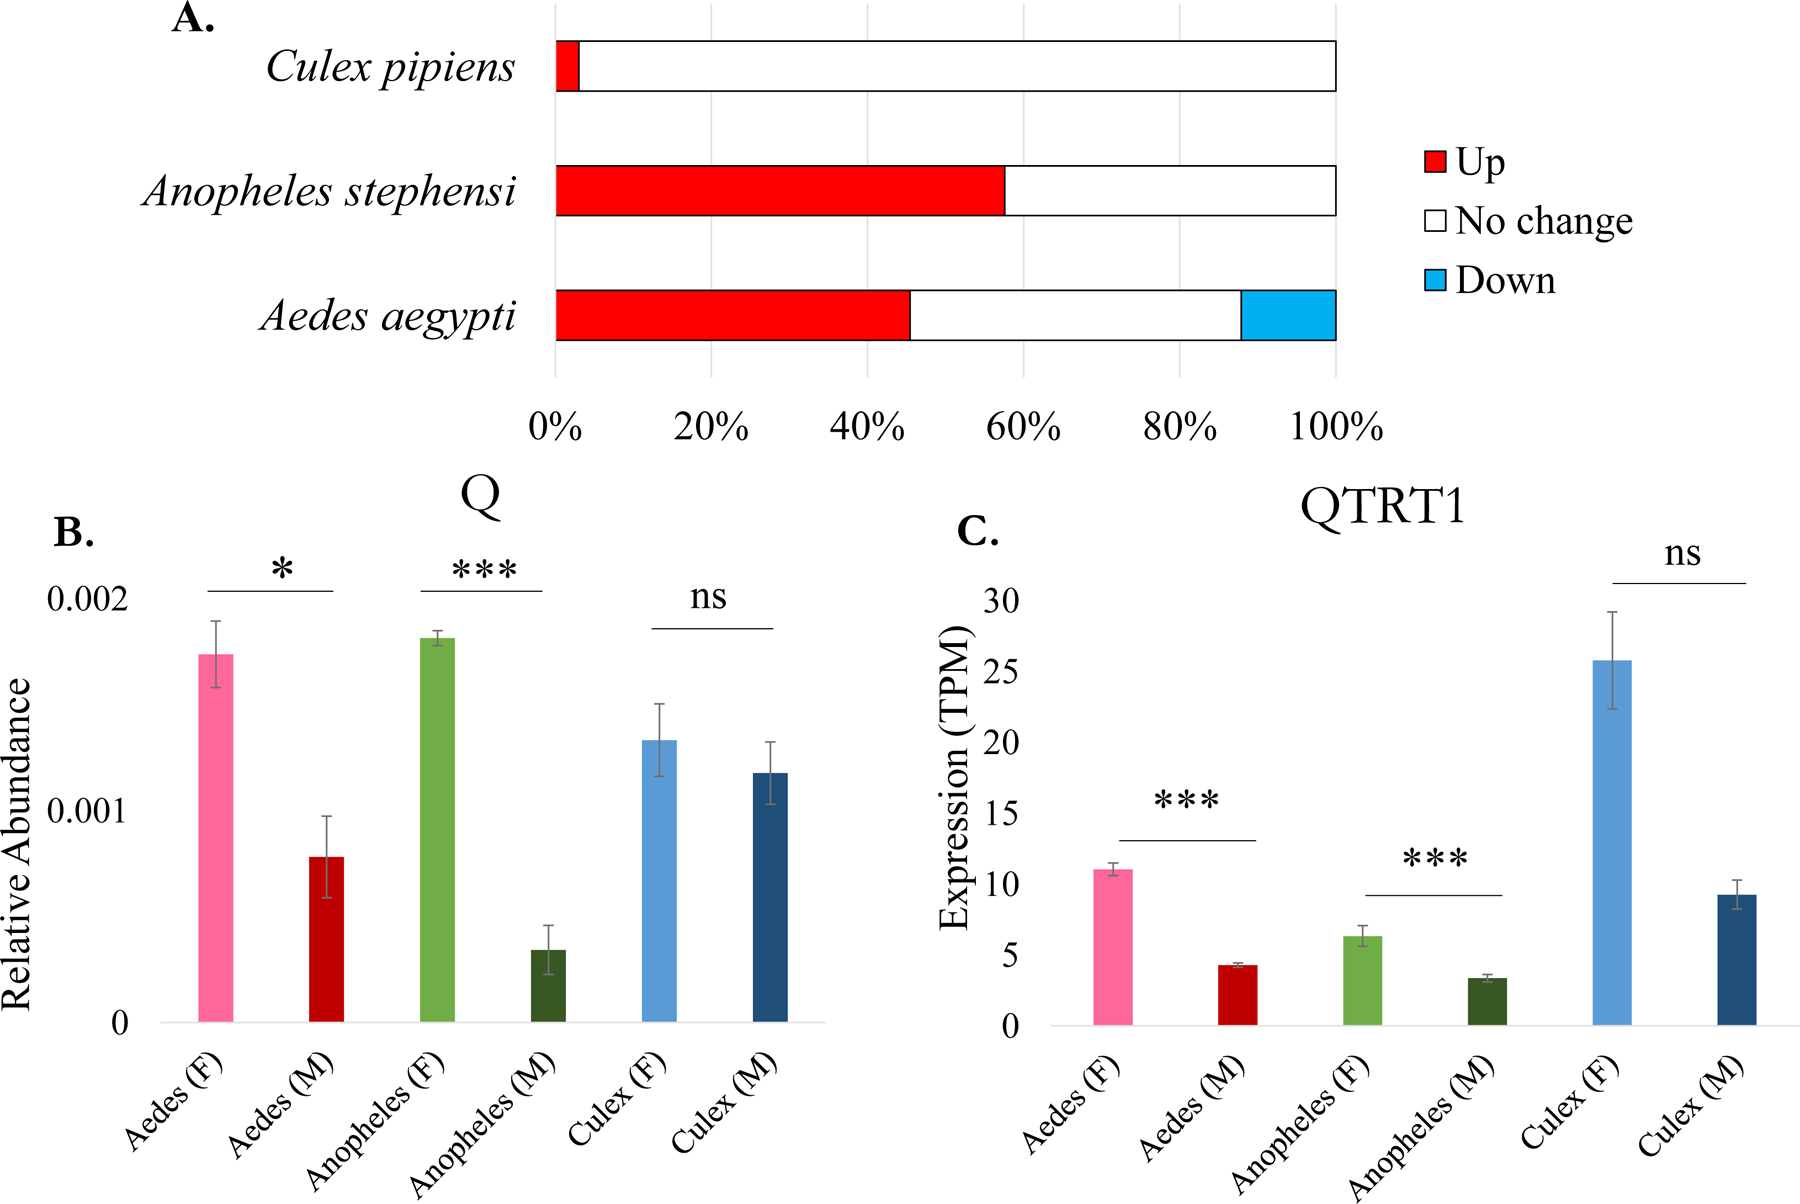
Figure 3. Summary of tRNA modification abundance differences and correlation of specific enzyme transcript levels.

A. Percentage of tRNA modifications with sex-specific differences in abundance.The percentage of tRNA modifications exhibiting relative abundance changes as increases in females (pink), no change (gray), or decrease in females (blue). B. Relative abundance of the tRNA modification queuosine (QtRNA) in each of the groups. The peak area of QtRNA was normalized with the sum of the canonical peak areas. Significance was considered if p-value < 0.05 between the males and females. C. Expression values of the catalytic subunit of the tRNA-modifying enzyme Q transferase, QTRT1, in TPM.
