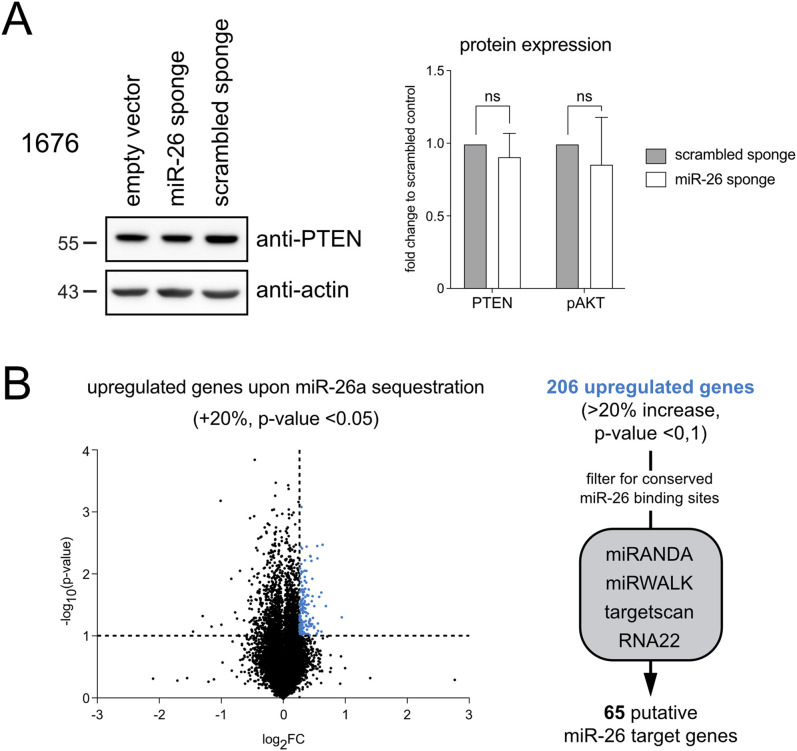
Figure 7. Transcriptome analysis does not identify clear target genes upon miR-26 sequestration.
(A) Western blot analysis comparing PTEN protein expression in 1676 pre-B cells expressing the miR-26 sponge or a scrambled control. Beta-actin serves as a loading control. The Bar chart shows the statistical analysis for PTEN and phosho-AKT. (B) A volcano plot comparing the transcriptional landscape in miR-26 sponge-expressing 1676 pre-B cells and the respective control (two independent experiments). The horizontal dashed line marks the P-value cutoff (P < 0.1), the vertical line depicts an up-regulation by 20% or more. Genes that are significantly up-regulated in response to miR-26 sequestration are displayed in blue. The flow chart on the right summarizes the strategy for miR-26a and b target identification in analogy to Fig 4A.

