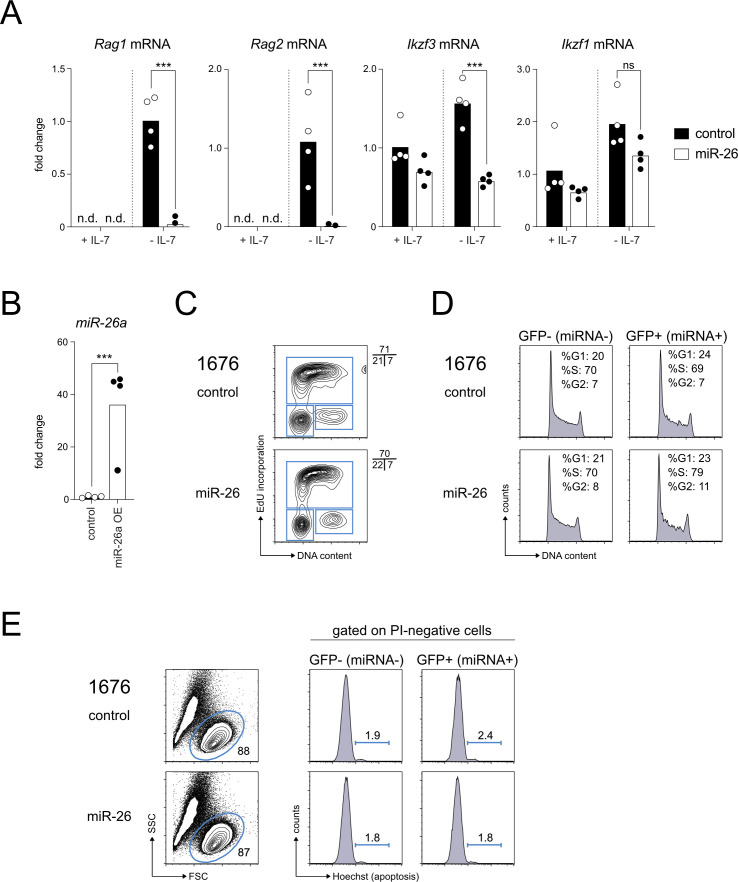
Figure S1. Aberrant expression of miR-26 counteracts the transcriptional reprogramming upon IL-7 withdrawal, but does not induce a clear pro-survival or anti-apoptotic effect under steady state conditions.
(A) 1,676 cells expressing an empty control vector or miR-26a were cultured in the presence of IL-7 or without IL-7 for 48 h before total RNA preparation and quantitative PCR analysis of Rag1, Rag2, Ikaros (Ikzf1), and Aiolos (Ikzf3) expression. Expression of beta-actin was used as a reference. Samples in which the respective amplicon was not detected were excluded from the analysis and are not shown. When not found in any sample under a certain condition, the respective mRNA was considered as not detectable (n.d.). (B) Quantitative PCR for miR-26a in 1,676 control cells as well as in 1,676 cells overexpressing hsa-miR-26a in the presence of IL-7. (C) 1,676 cells transduced with an empty control vector or expressing miR-26a and cultured in the presence of IL-7 were labeled with 10 μM EdU for 1 h, stained for EdU incorporation and DNA content and analyzed by flow cytometry. The numbers correspond to the respective percentages in the G1 (lower left), S (upper) and G2 (lower right) cell cycle phases. (D) DNA content staining of 1,676 cells expressing miR-26a or an empty control vector as based on expression of GFP as a fluorescent marker (right panel). Non-transduced cells (GFP−/miRNA−) within the same sample serve as an internal control. Numbers indicate the percentages of cells in G1, S and G2 as defined by the flow cytometric analysis. (E) Quantification of apoptosis as determined by chromatin condensation in cells expression miR-26a or a control under steady-state conditions, i.e., with excessive amounts of IL-7. Cells were stained with PI and Hoechst 33342, and apoptotic cells (defined as PI-negative and Hoechst 33342hi) were determined by flow cytometry.

