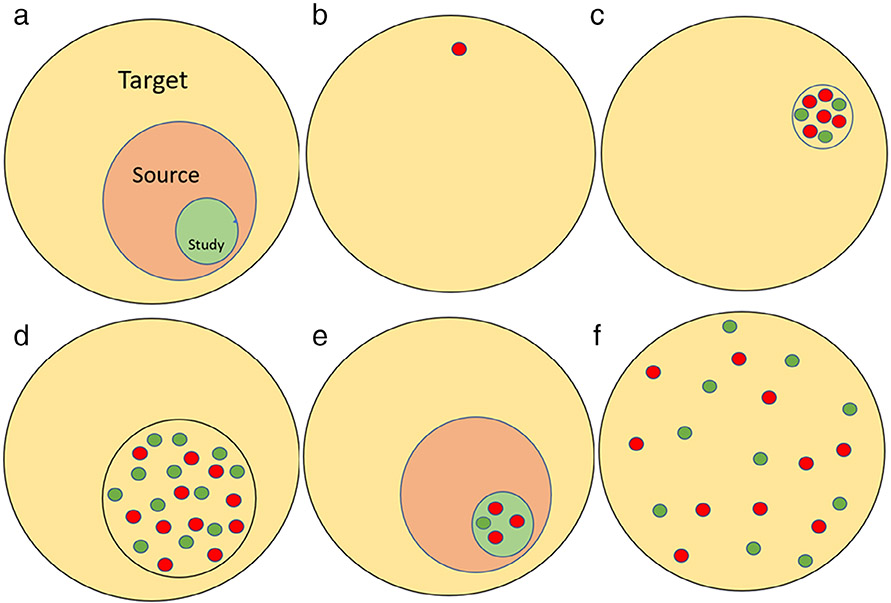
Figure 3.
The figure illustrates AE from various studies. Panel a shows how we would like to make inferences to a target population from a study population that was performed on a source population that can be enumerated. Panels b and c reveal case reports and case series from patients with IDDS. Notice that they often highlight cases with more severe AE (red circles) than milder AE (green circles). Panel d shows AE from clinical registries, which are a subset of all the IDDS patients. There may be a selection bias associated with clinical registries. Panel e shows AE from clinical trials. Often the AE rates are low and are not representative of the real-world practice. Panel f shows AE from passive surveillance systems like MAUDE. They represent real-world data, and the limitations are concerns with follow-up and lack of standardization of data reporting.

