
Fig. 1.
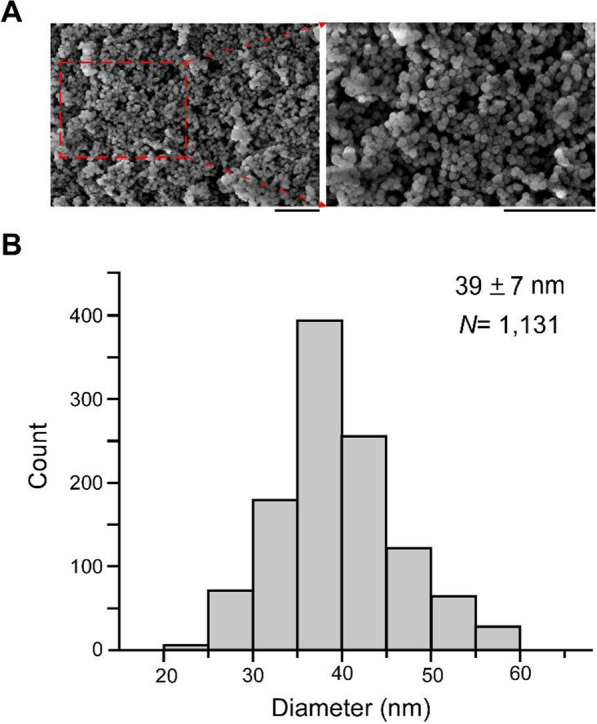
SiO2 NPs under investigation. A Scanning electron microscope (SEM) images of the particle. Scale bar, 500 nm. B Particle size distribution based on the SEM image analysis. Averages ± standard deviations
Official websites use .gov
A
.gov website belongs to an official
government organization in the United States.
Secure .gov websites use HTTPS
A lock (
) or https:// means you've safely
connected to the .gov website. Share sensitive
information only on official, secure websites.
SiO2 NPs under investigation. A Scanning electron microscope (SEM) images of the particle. Scale bar, 500 nm. B Particle size distribution based on the SEM image analysis. Averages ± standard deviations